xyfinz
Data analysis as x,y,f,i,n,z
2025-05-01
‘xyfinz’: A framework for data analysis projects

about me
- Economics prof by day, data analyst by (other) day
- Central European University (Vienna, AT) + Research job in Budapest
- Research on organizations w data from football, OSS, history
- Occasional consulting: “adult supervision”

Linkedin: linkedin.com/in/bekesgabor/ BlueSky: gaborbekes.bsky.social
about me
- Economics prof by day, data analyst by (other) day
- Central European University (Vienna, AT) + Research job in Budapest
- Research on organizations w Github data
- How teams formed, and their success
- Modelling OSS development process
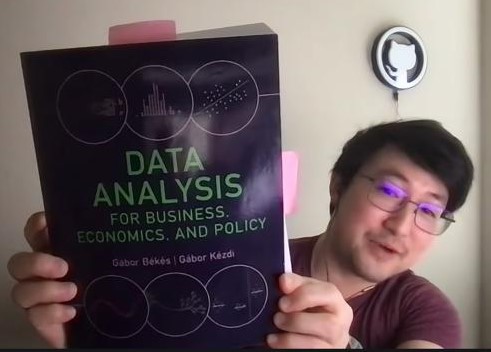
- Data Analysis Textbook
Linkedin: linkedin.com/in/bekesgabor/ BlueSky: gaborbekes.bsky.social
Data Analysis Textbook: gabors-data-analysis.com, repo: github.com/gabors-data-analysis/
The x and y: association – setup
Association Analysis
Understanding patterns, comparing conditional means
Compare average y for different values of x
First step, works for any dataset
Reveals relationships without making strong claims
Helps identify potential variables of interest
Generates hypotheses for further investigation

The x and y: prediction – setup
Prediction = Modelling for the future
Take the data we have to build model(s) = training data
Train data: x and y known
Use the model in a data in the future = live data
Live data: x known, y predicted

The x and y: causality – setup
Causal inference
Causal inference * understanding the what if question * Causality = Is room for an intervention (action) by an agent
Actions - Commit more frequently / Require a minimum amount of change per commit - Allow/Prohibit access to ChatGPT/GH copilot - Change diet

y~f(x) is the relationship between y and x
Thinking about the nature of relationship
- Data analysis compares mean y conditional on observable x:
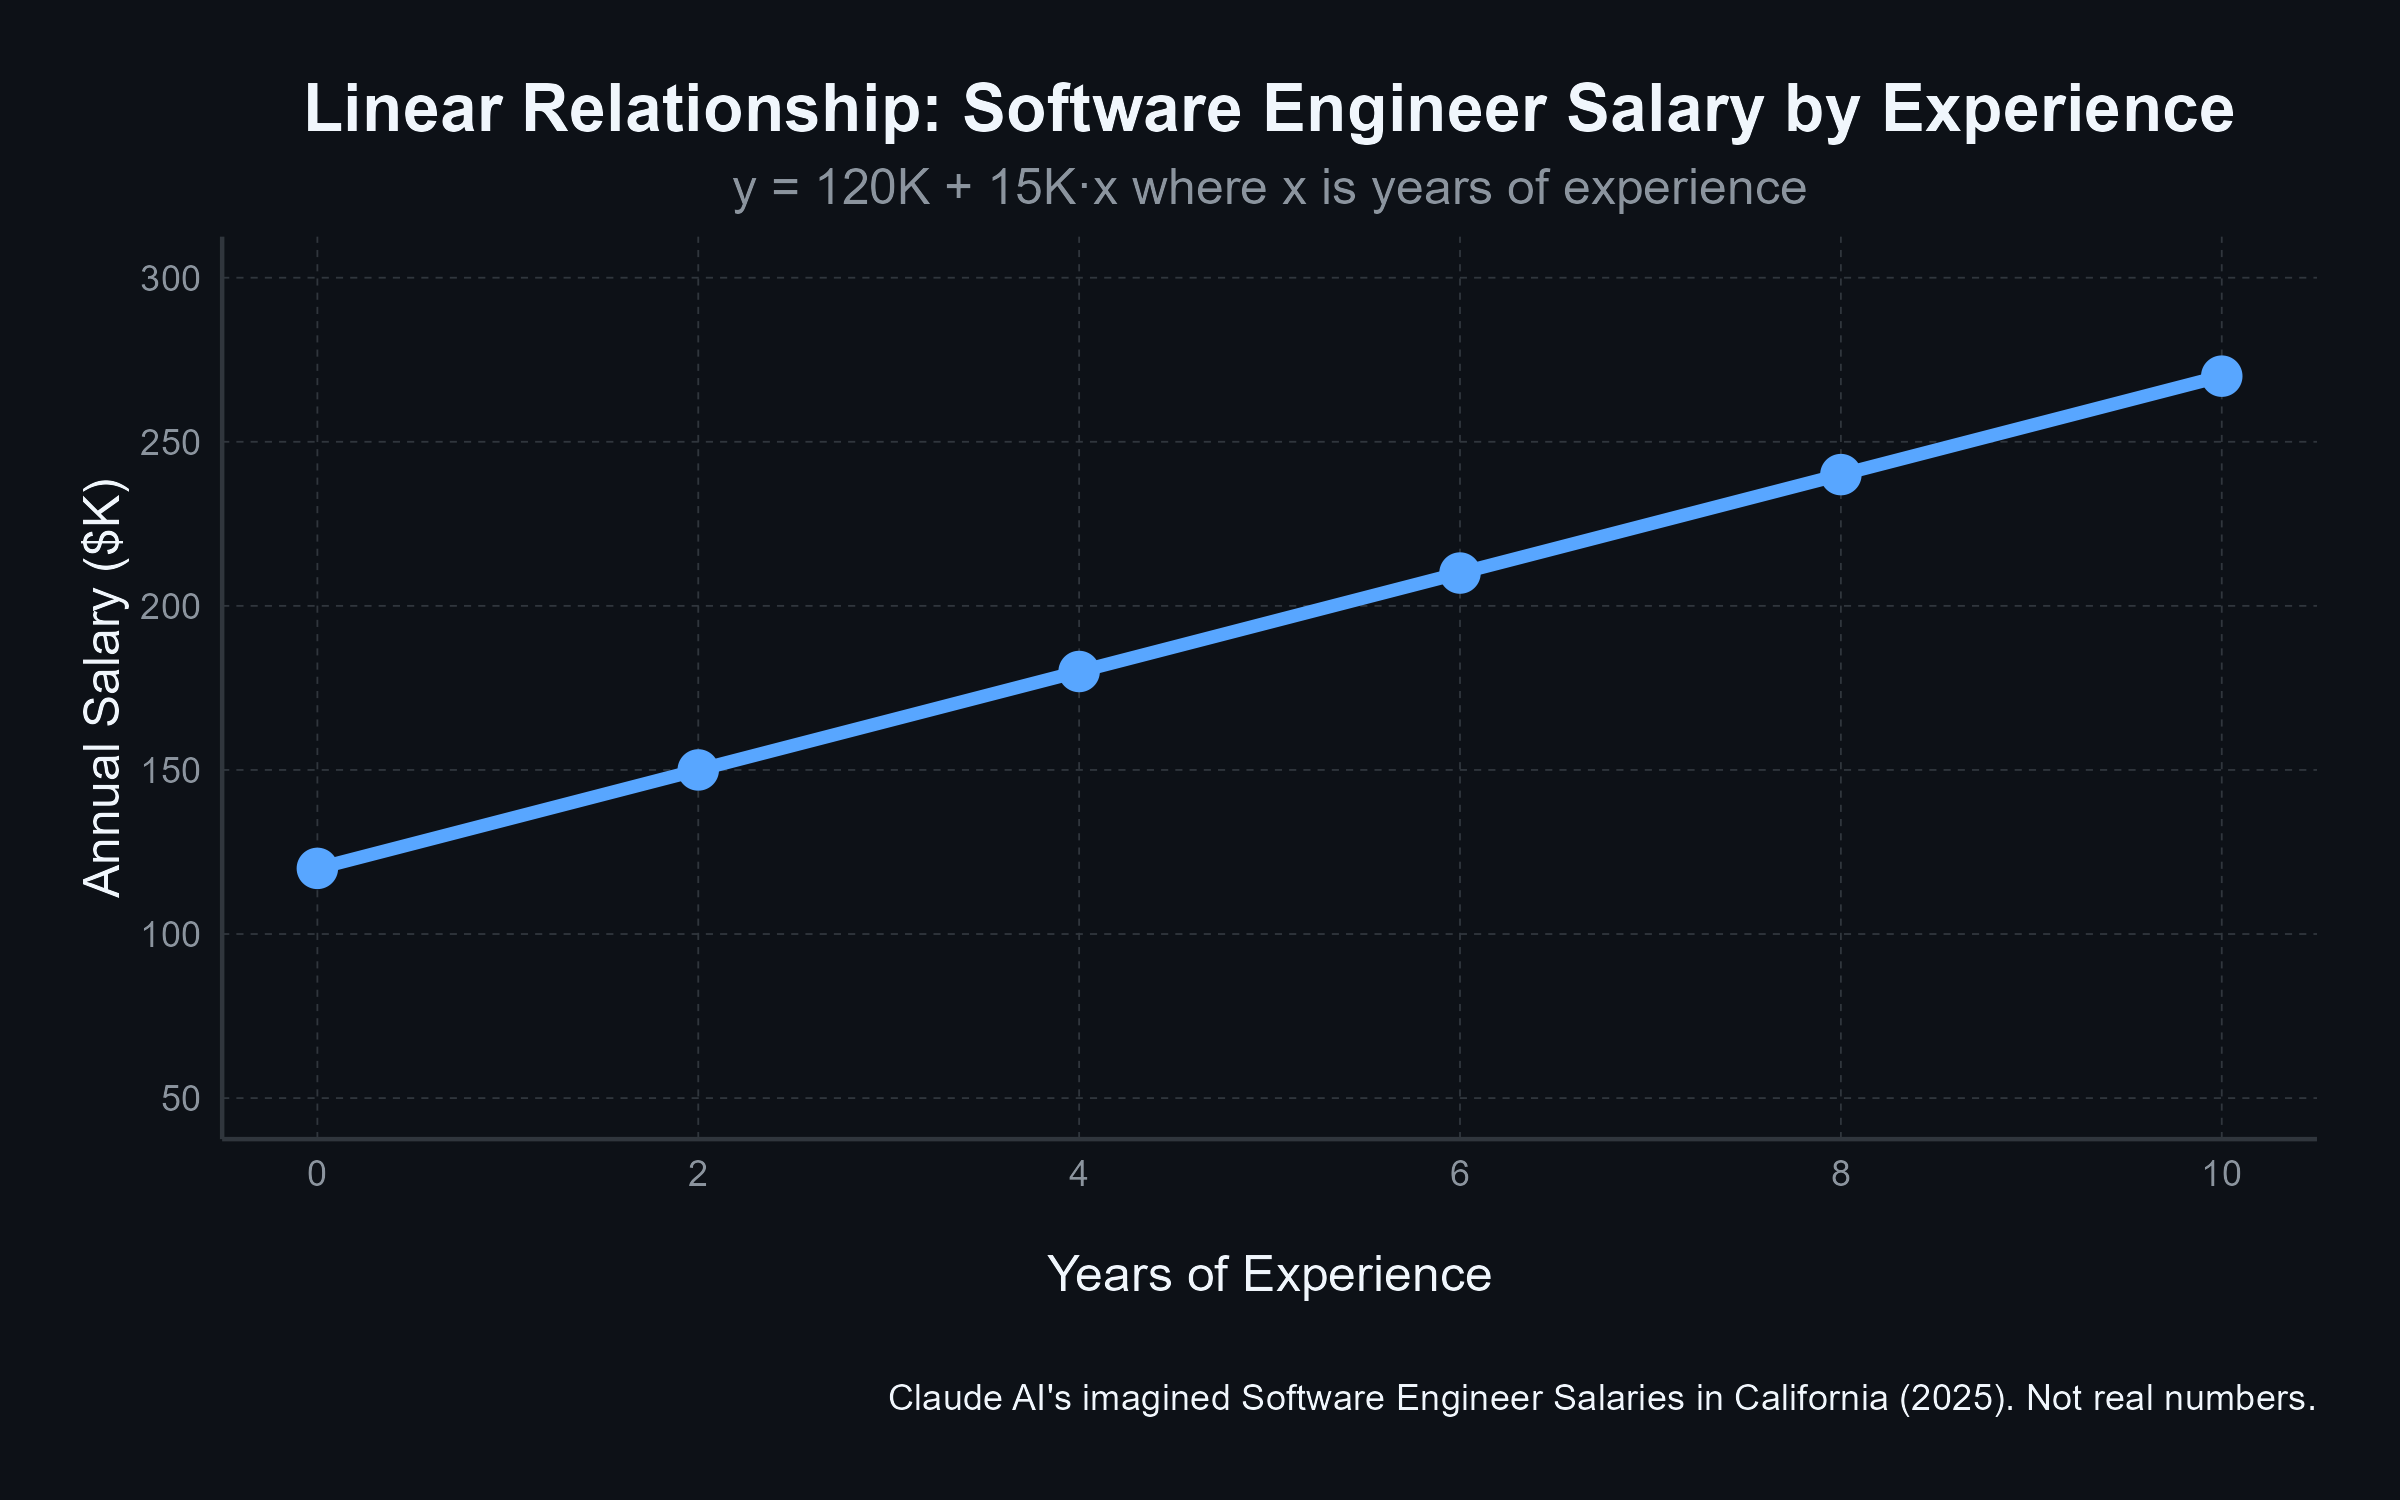
- Average salary by years of experience:
- Tasks completed by AI usage:
- f(x) defines how x relates to y - we can model this relationship in different ways

The relationship: y~f(x): Examples

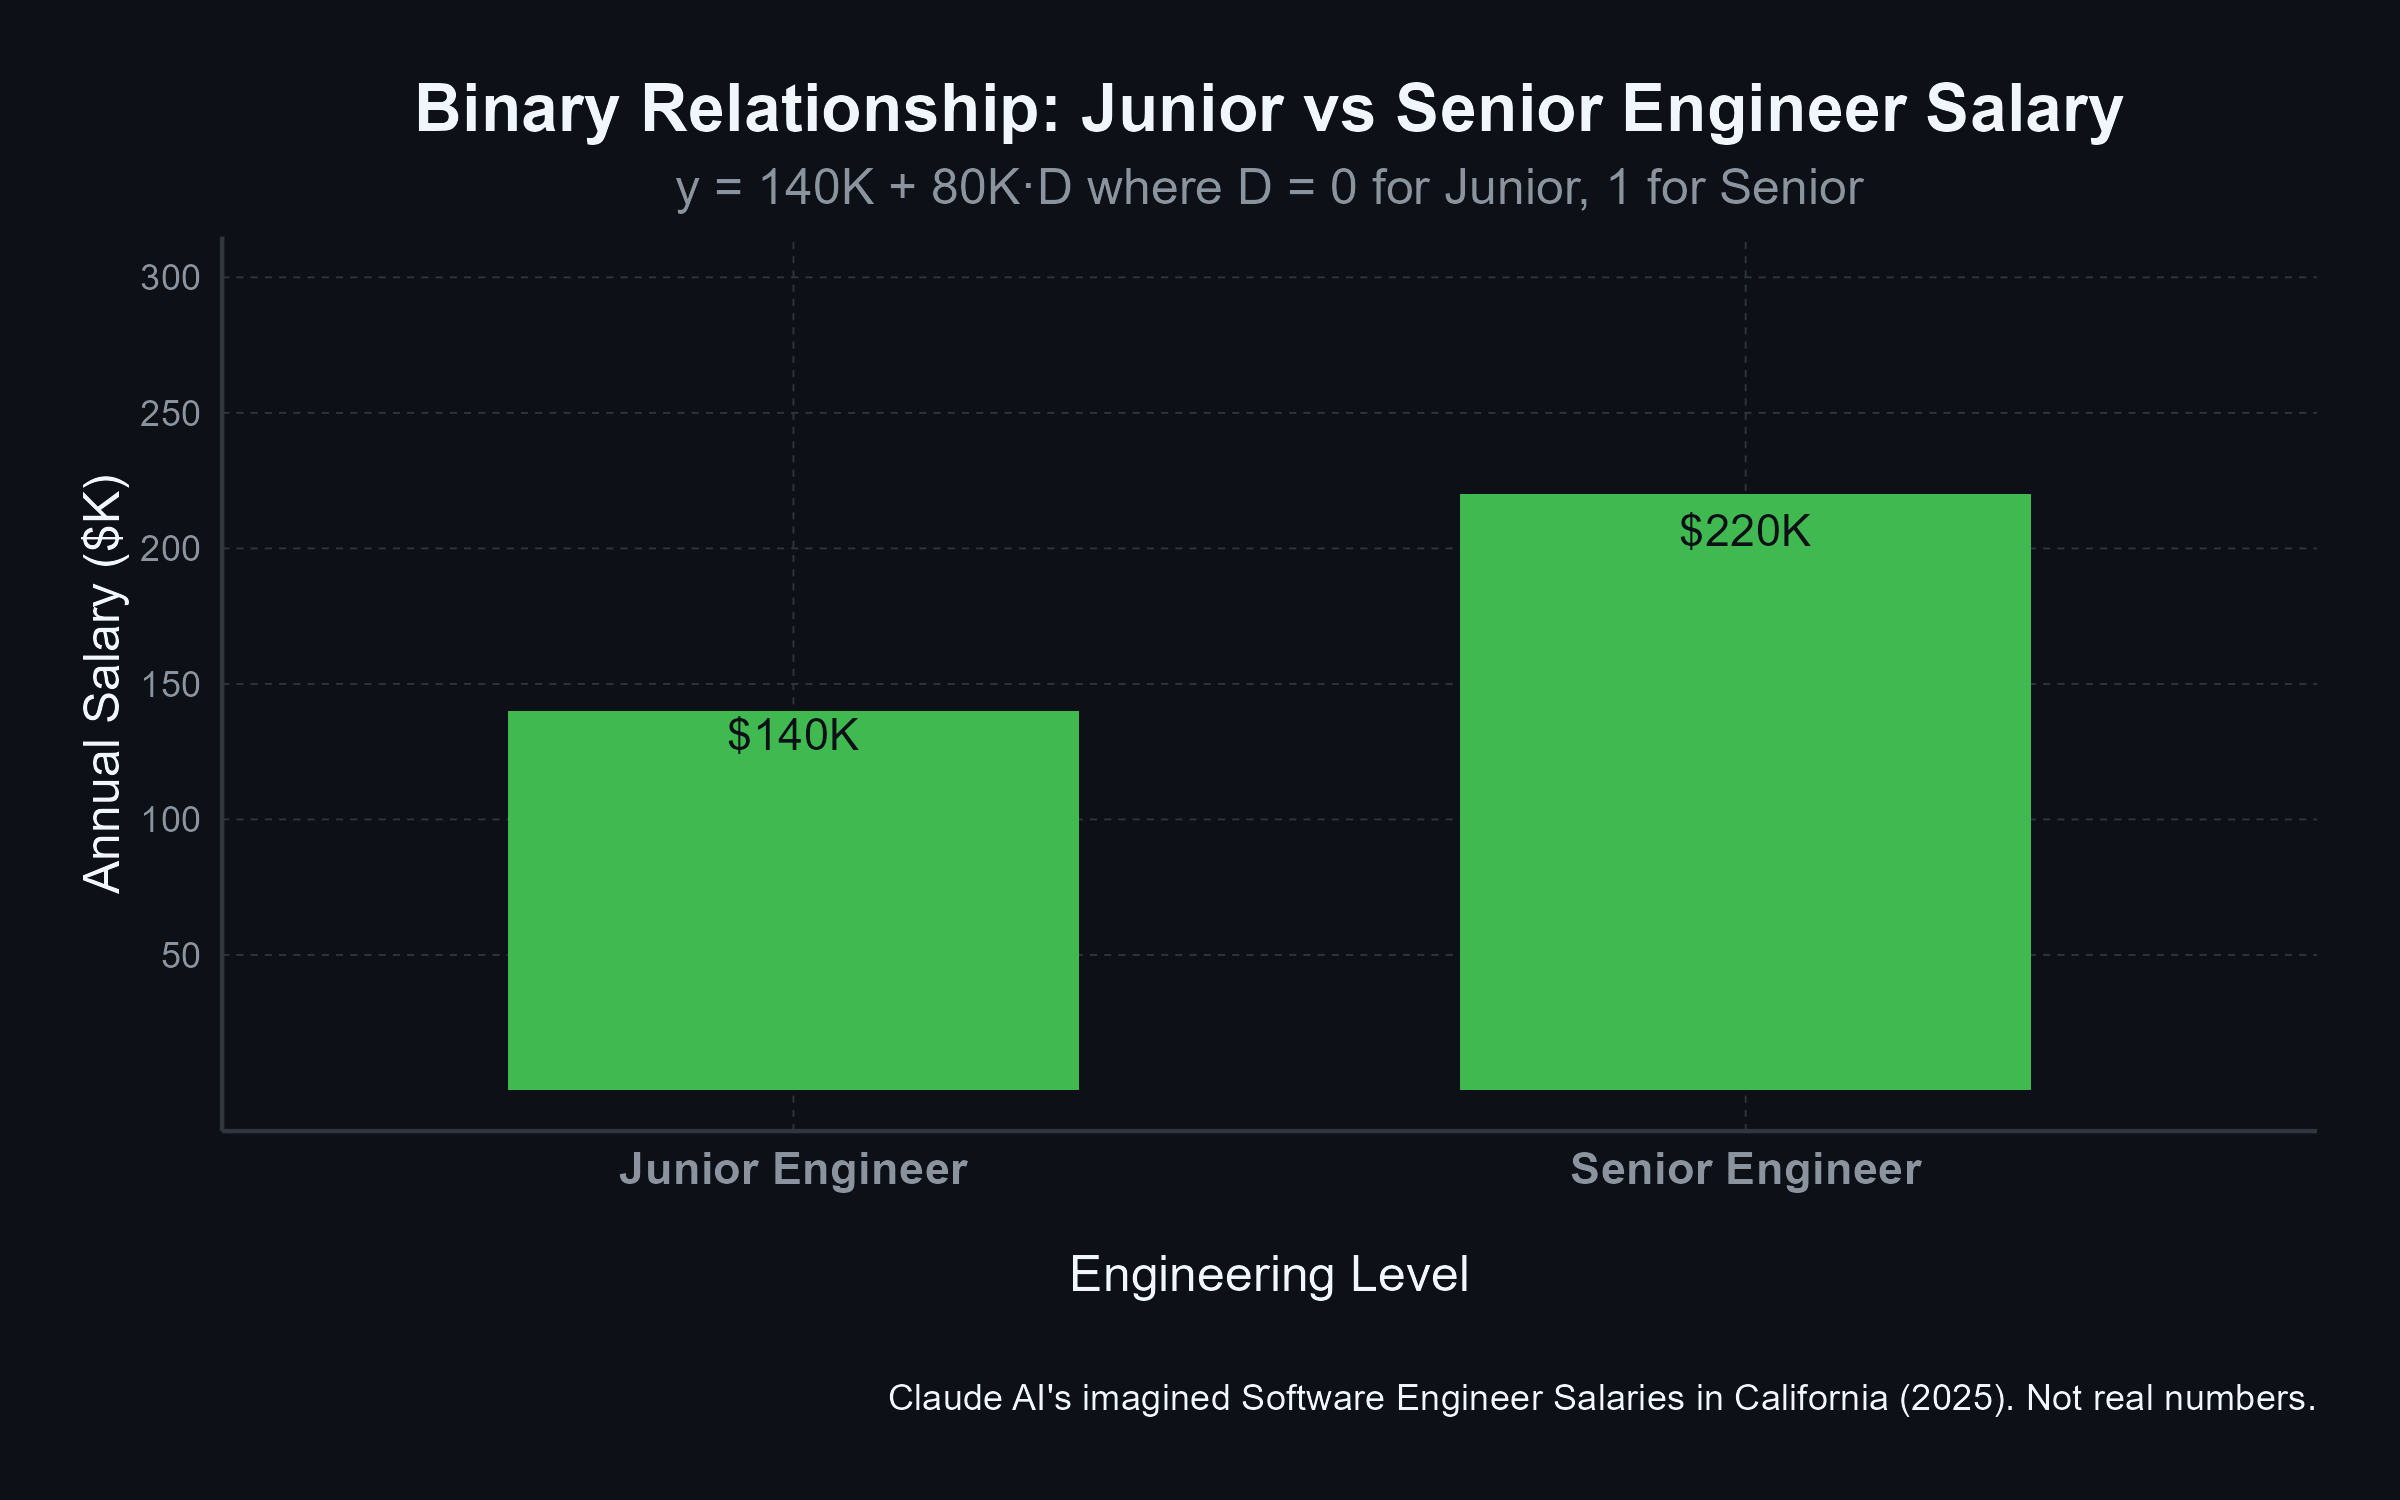
f(x): Binary Relationship
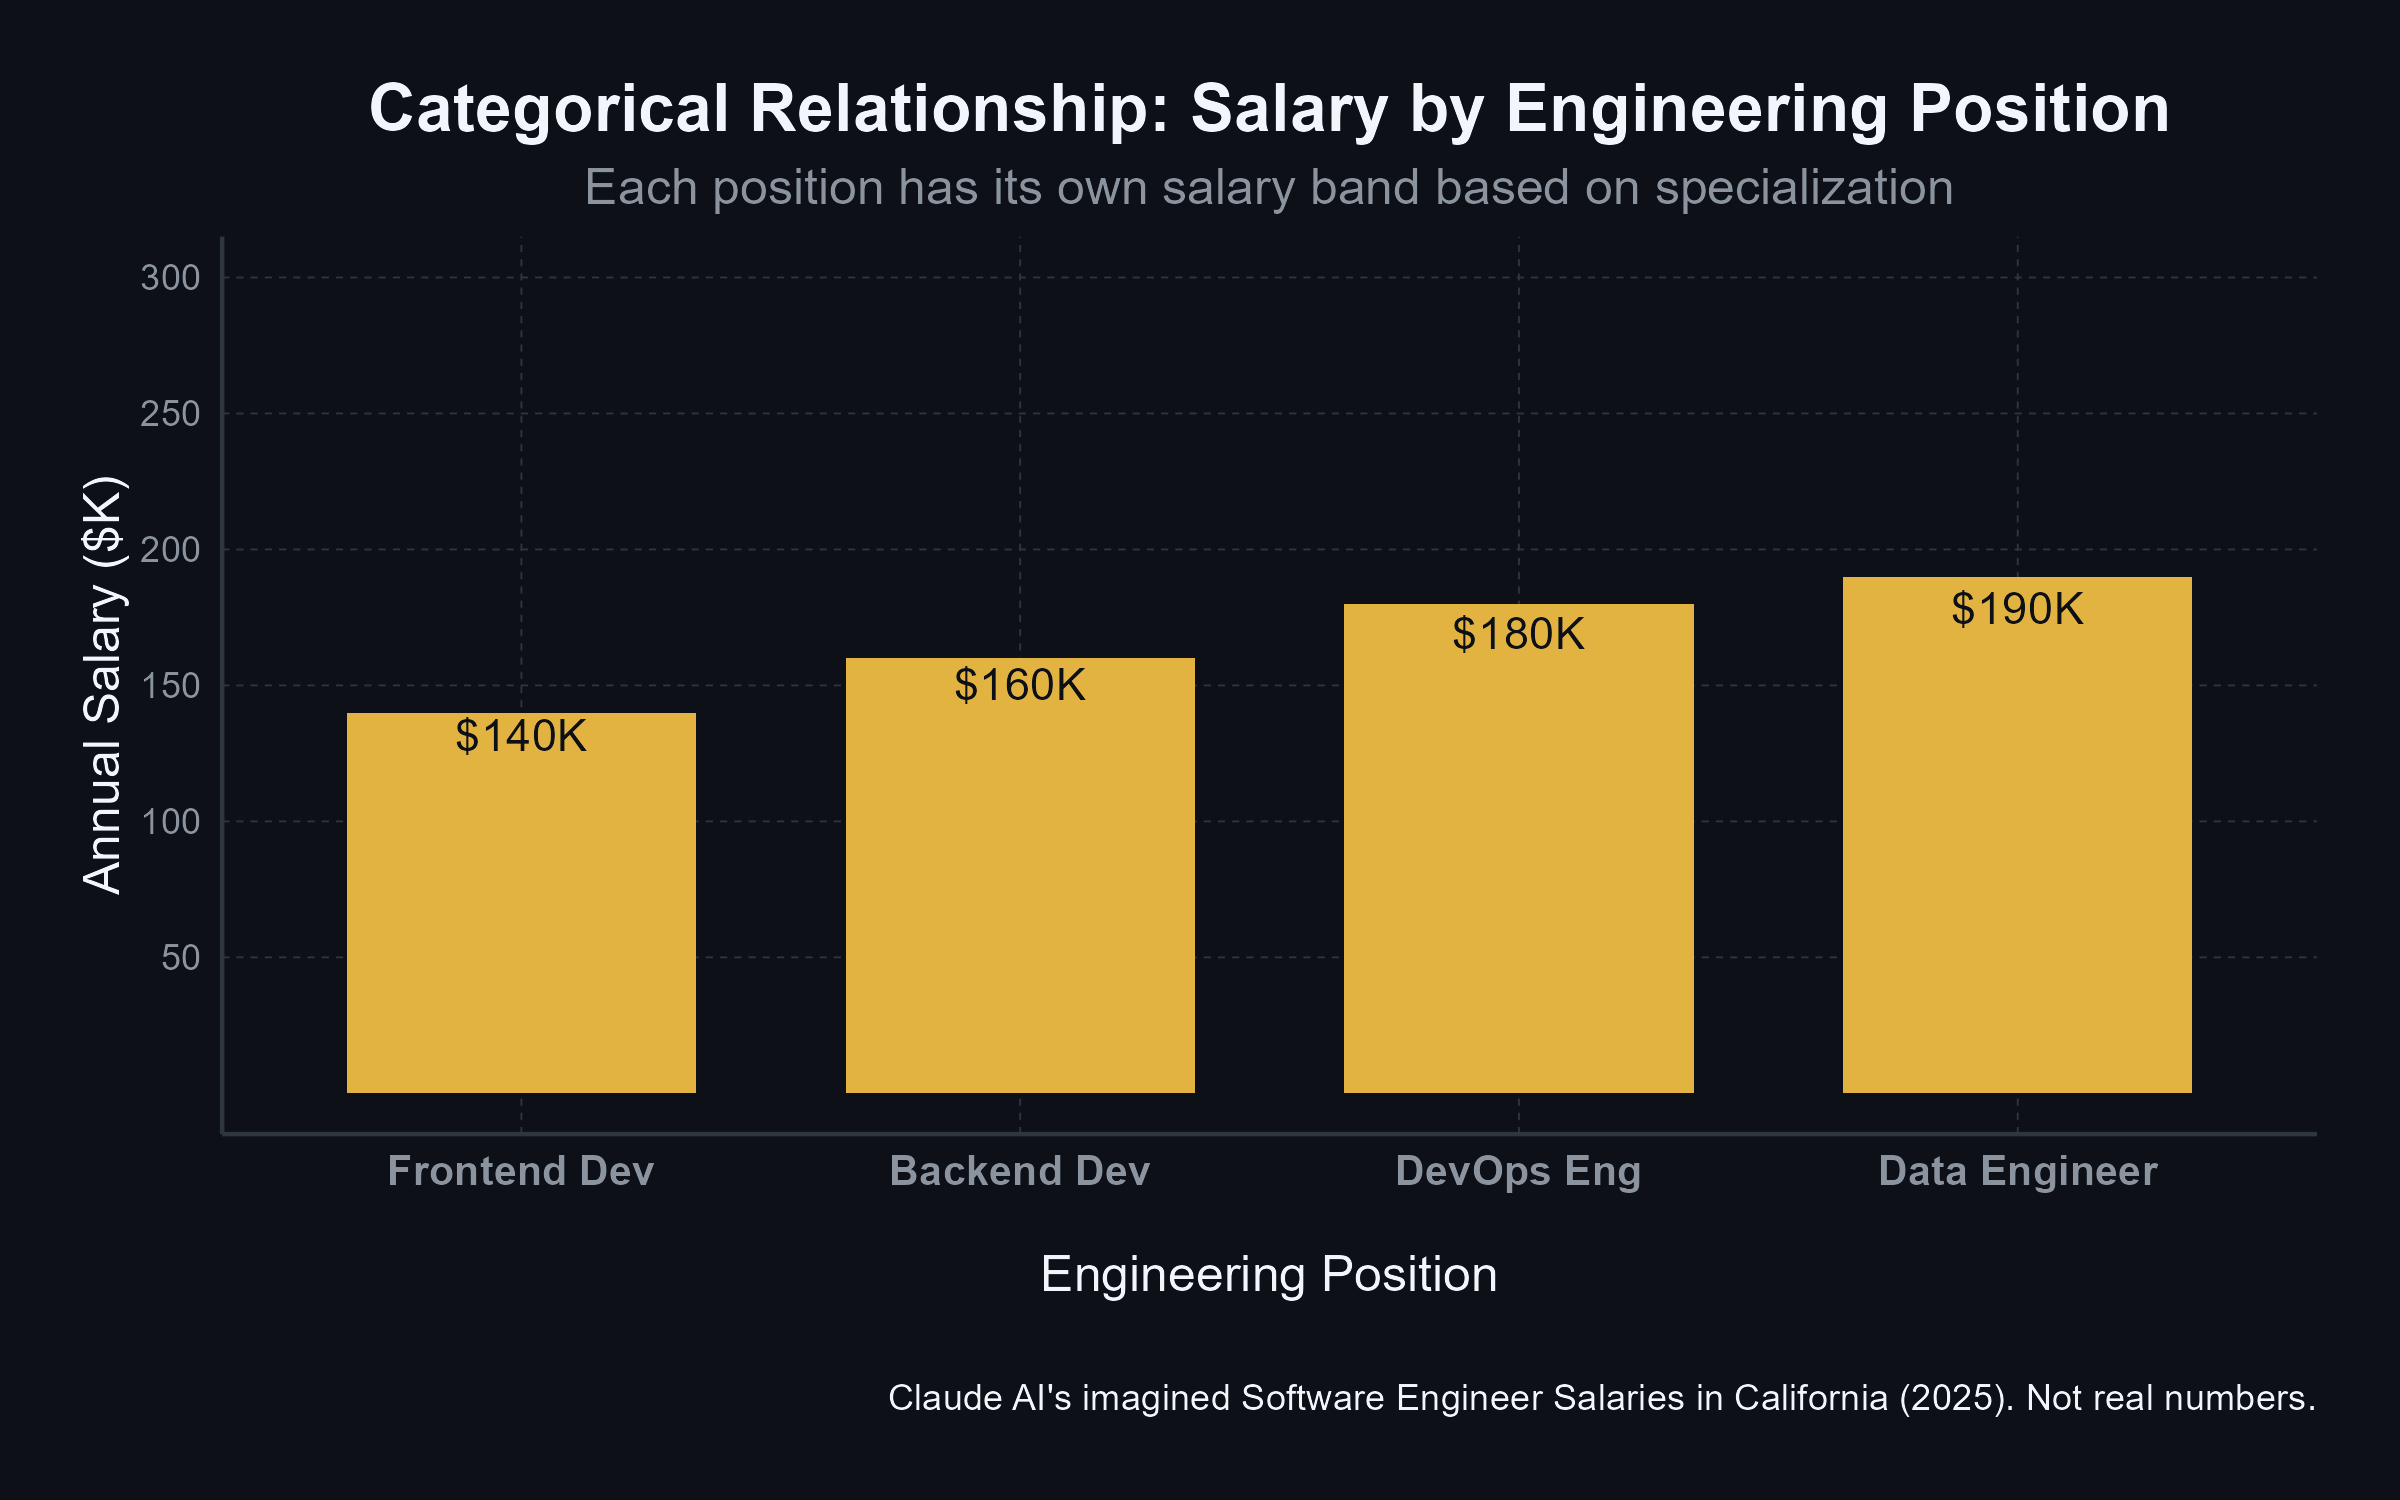
f(x): Categorical Relationship
f(x): Linear Relationship
f(x): Quadratic Relationship

What is an observation i – analyst decision
- Analyst might aggregate
- Decision on how to aggregate is analyst’s decision (~ RQ, legal, technical)

N is the size of the dataset
Dataset size matters greatly for prediction
- Large data – easier building predictive models
- We have more chance finding patterns
Dataset size also helpful – gives us more certainty
- Causal questions
- Experiments

Z is what confounds the causal analysis
- People who eat more veggies (x) have lower blood pressure (y)
- Causal claim: let us make people eat more veggies to get lower bp
Confounder (z) are variables to prevent such claim
- In observational data: often

x,y,f,i,N,z – not independent
Framework Components Interact
- Each element influences the others
- Changes to one affect analysis strategy
x ↔︎ y ↔︎ f ↔︎ i ↔︎ N ↔︎ z

Larger N → more complicated f(x)
- Big data
- More observations, more variables
- f(x), f(z) can be more nuanced
- Machine learning.

Check out my textbook feel free to reach out
I’m around:
Linkedin: linkedin.com/in/bekesgabor/ BlueSky: gaborbekes.bsky.social
Check out
Data Analysis Textbook: gabors-data-analysis.com, repo: github.com/gabors-data-analysis/
