About
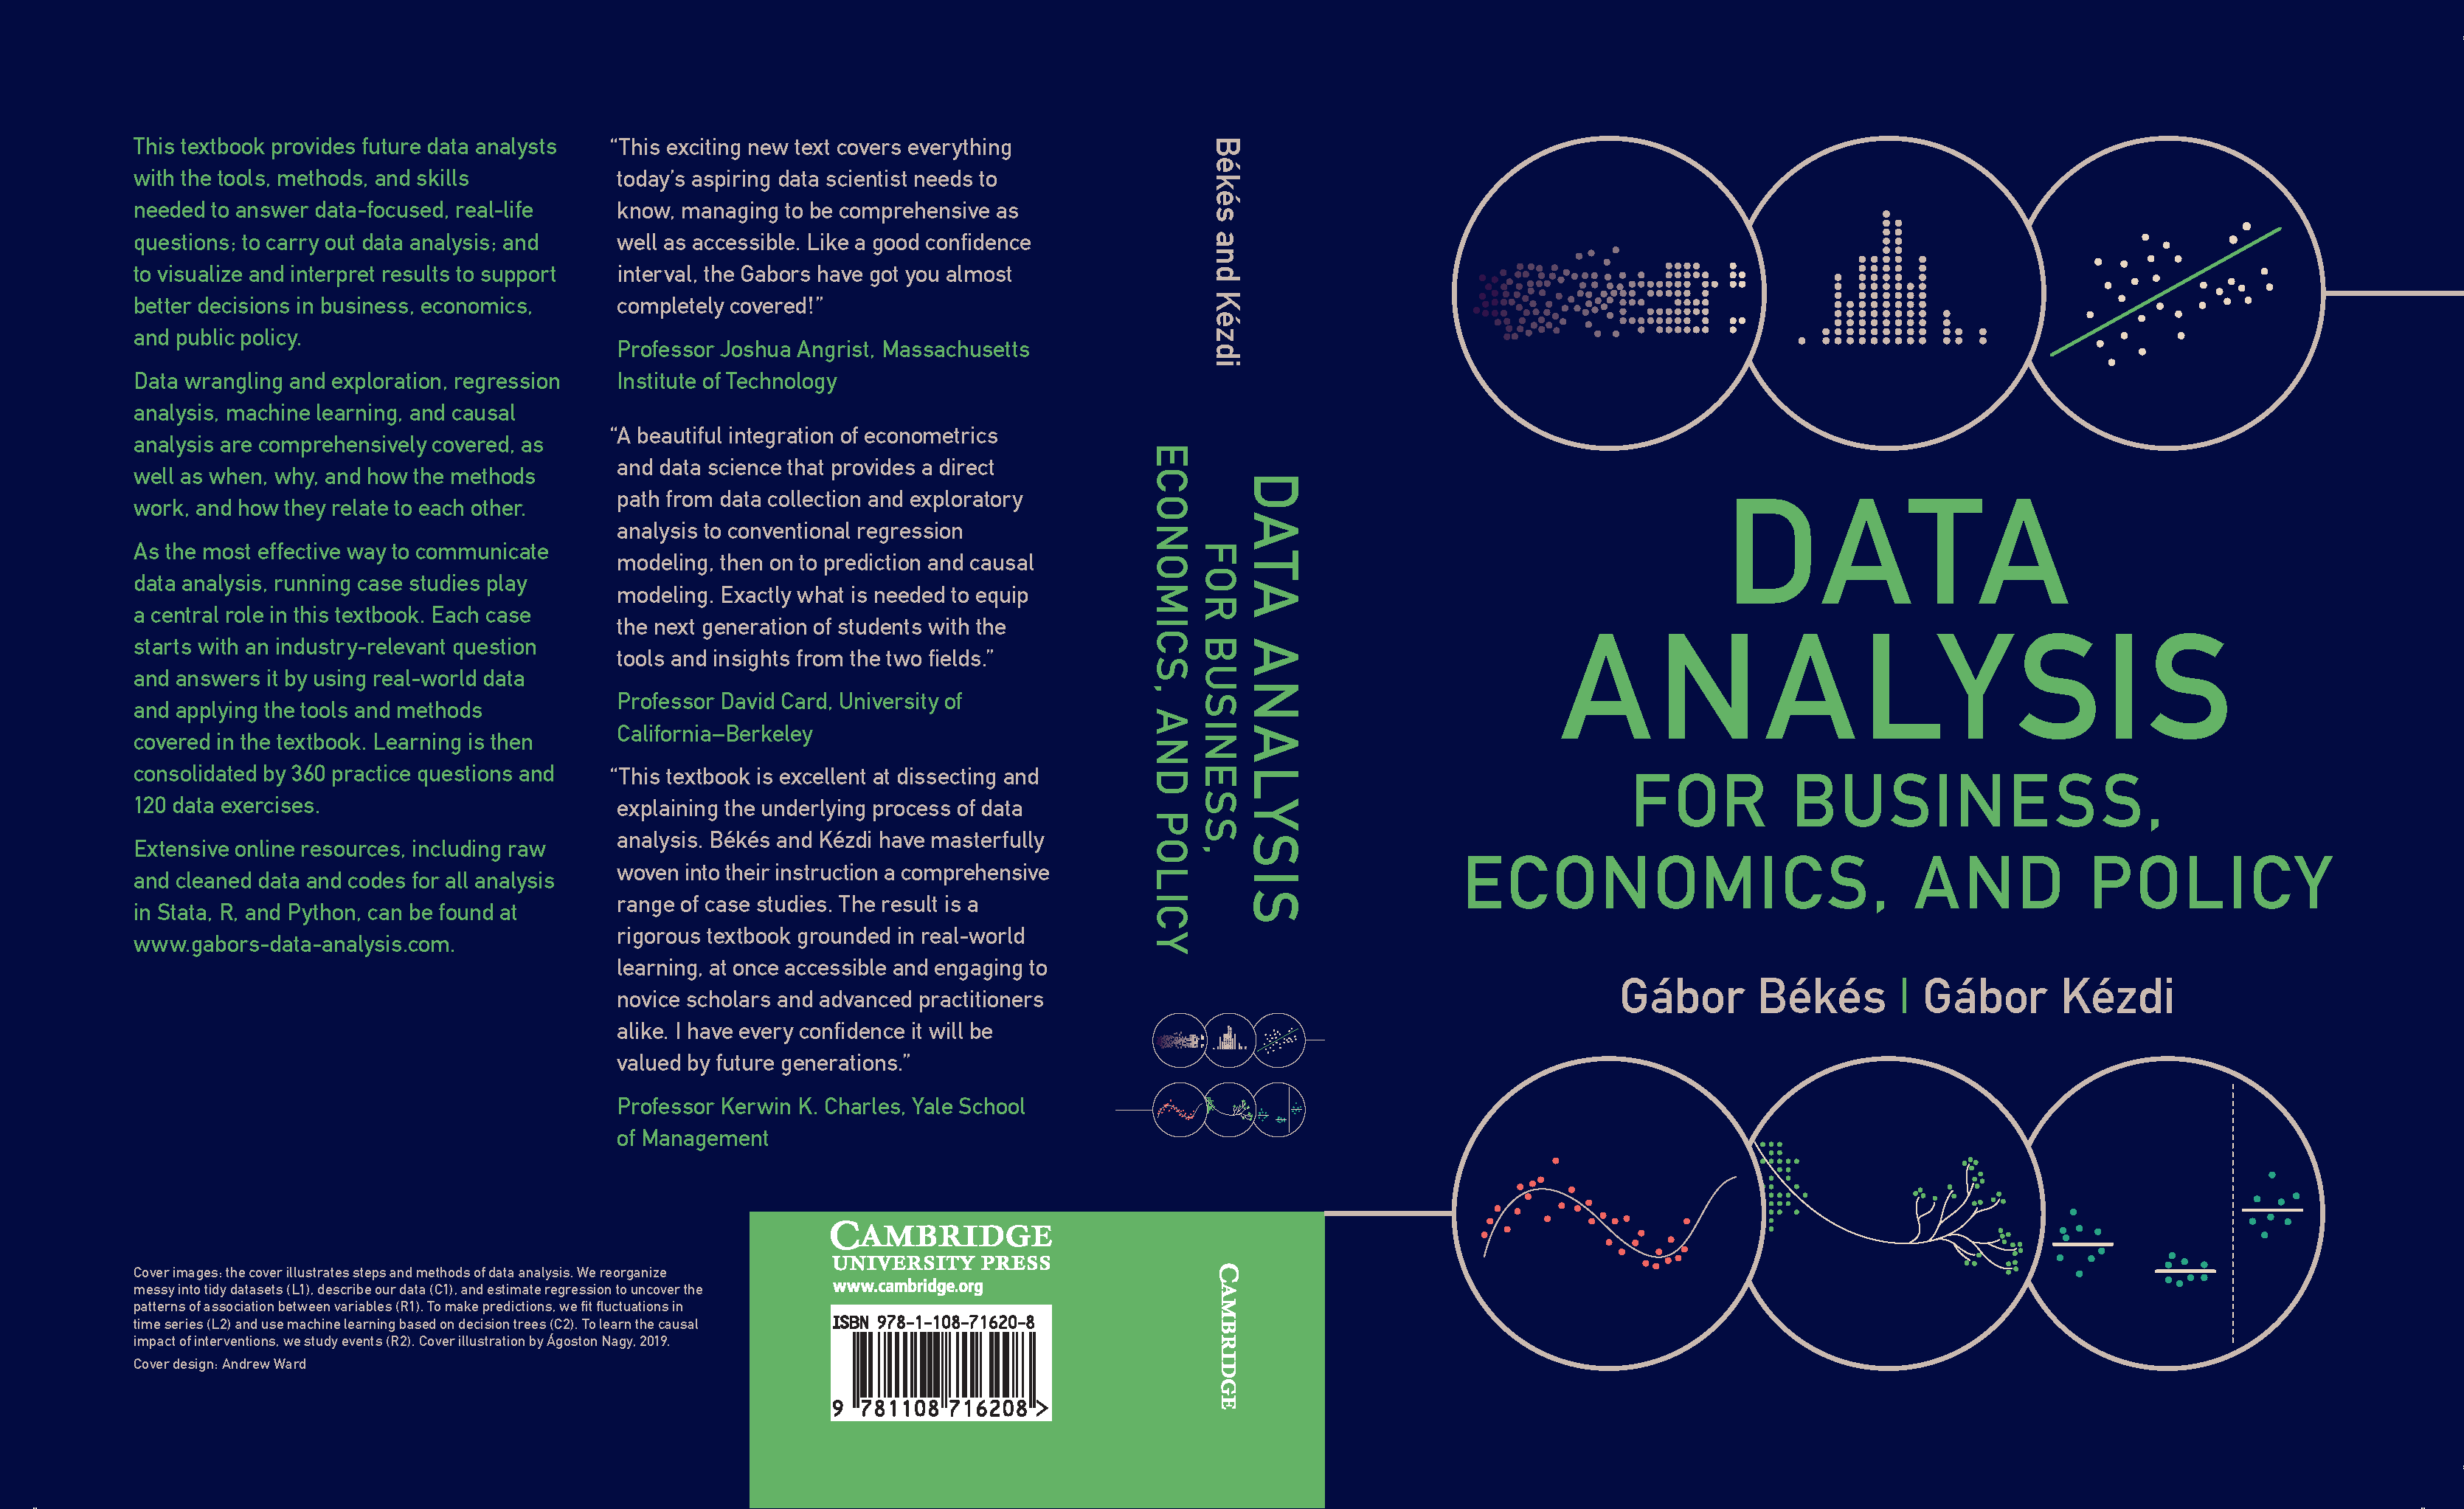
This textbook provides future data analysts with the tools, methods, and skills needed to answer data-focused, real life questions, to choose and apply appropriate methods to answer those questions, and to visualize and interpret results to support better decisions in business, economics, and public policy. More
Buy the book: Amazon.com, or global options. Request an examination copy
Navigation for teaching and learning
Instructor Resources - teaching guide, supplementary recources, list of courses using, support.
Student Resources - quick links, coding setup, Q&A, recommendations.
Content
The textbook offers a complete, curated curriculum that equips future data analysts with the most important tools, methods and skills they need through the entire process of data analysis to answer data focused, real life questions.
- Data exploration – data collection and quality, tidy data and wrangling, exploratory data analysis and visualization, generalizing from data, and hypothesis testing.
- Regression analysis – non-parametric and linear models, functional form, internal and external validity, probability models and time series regressions.
- Predictive analytics – loss function, cross-validation, tree-based machine learning methods (CART, RF, boosting), classification, and forecasting from time series data.
- Causal inference – potential outcomes framework and causal maps/DAGs, experiments, matching, difference-in-differences analysis, panel data methods, synthetic control, event study.
More on the chapters content →
Why use this book?
This textbook was written to be a complete course in data analysis. This textbook could be useful for university students in graduate programs as core text in applied statistics and econometrics, quantitative methods, or data analysis. It may also complement online courses that teach specific methods to give more context and explanation. Undergraduate courses can also make use of this textbook, even though the workload on students exceeds the typical undergraduate workload. Finally, the textbook can serve as a handbook for practitioners to guide them through all steps of real-life data analysis.
Case studies: global and diverse
This textbook includes 47 case studies, each beginning with a real question and ending with an answer based on real data and the methods taught in that chapter. Examples:
- Estimating gender and age differences in earnings (USA). More
- Management quality, firm size and family ownership (Mexico, International). More
- Predicting company default with machine learning (EU). More
- Working from home and employee performance (China). More
- Identifying successful football managers, and the effect of a change (UK). More
Data & Code
All textbook materials are openly available, with code to reproduce every output in R, Stata, and Python.
- Code: Browse the GitHub repository or download the latest release.
- Datasets: See dataset summaries and access the full collection (raw and clean) via our OSF repository.
Endorsers & Reviewers: “comprehensive”, “accessible”, “fun to read”
“Comprehensive and accessible… exactly what is needed.”
— David Card, UC Berkeley, Nobel laureate
“A beautiful integration of Econometrics and Data Science.”
— Joshua Angrist, MIT, Nobel laureate
“Must purchase for anyone doing applied work… Perfect for data scientists of all stripes (including Econ)”
— Scott Cunningham, Baylor University and Harvard University, Author of Causal Inference: The Mixtape
More endorsements → · Instructor feedback →
Programmes using the textbook
The textbook has been adopted by more than 90 programmes worldwide in Economics, Finance, Analytics, Business, and Public Policy.
Full list of courses using the book →
About authors
Gábor Békés and Gábor Kézdi at Balatonudvari, Hungary (July 2018). Photo by Anna Fetter.
Gábor Békés
Gábor Békés is an Assistant Professor at the Department of Economics and Business of the Central European University and director of the MS in Business Analytics program. He is a senior fellow at KRTK and a research affiliate at the Center for Economic Policy Research (CEPR). He published in top economics journals on multinational firm activities and productivity, business clusters, and innovation spillovers. He managed international data collection projects on firm performance and supply chains. He has done both policy advising (the European Commission, ECB) as well as private sector consultancy (in finance, business intelligence and real estate). He has taught graduate-level data analysis and economic geography courses since 2012.
Gábor Kézdi
Gábor Kézdi is a Research Associate Professor at the University of Michigan’s Institute for Social Research. He published in top journals in economics, statistics, and political science on topics including household finances, health, education, demography, and ethnic disadvantages and prejudice. He has managed several data collection projects in Europe; currently, he is co-investigator of the Health and Retirement Study in the U.S. He has consulted various governmental and non-governmental organizations on the disadvantage of the Roma minority and the evaluation of social interventions. He has taught data analysis, econometrics, and labor economics from undergraduate to Ph.D. levels since 2002 and supervised a number of MA and PhD students.
Thank you
We could not have done this alone. Far from it. So, we are grateful, really.


