Why use this book?
Why this book matters?
Data analysis is a process. It starts with formulating a question and collecting appropriate data, or assessing whether the available data can help answer the question. Then comes cleaning and organizing the data, tedious but essential tasks that affect the results of the analysis as much as any other step in the process. Exploratory data analysis gives context to the eventual results and helps deciding the details of the analytical method to be applied. The main analysis consists of choosing and implementing the method to answer the question, with potential robustness checks. Along the way, correct interpretation and effective presentation of the results are crucial. Carefully crafted data visualization help summarize our findings and convey key messages. The final task is to answer the original question, with potential qualifications and directions for future inquiries.
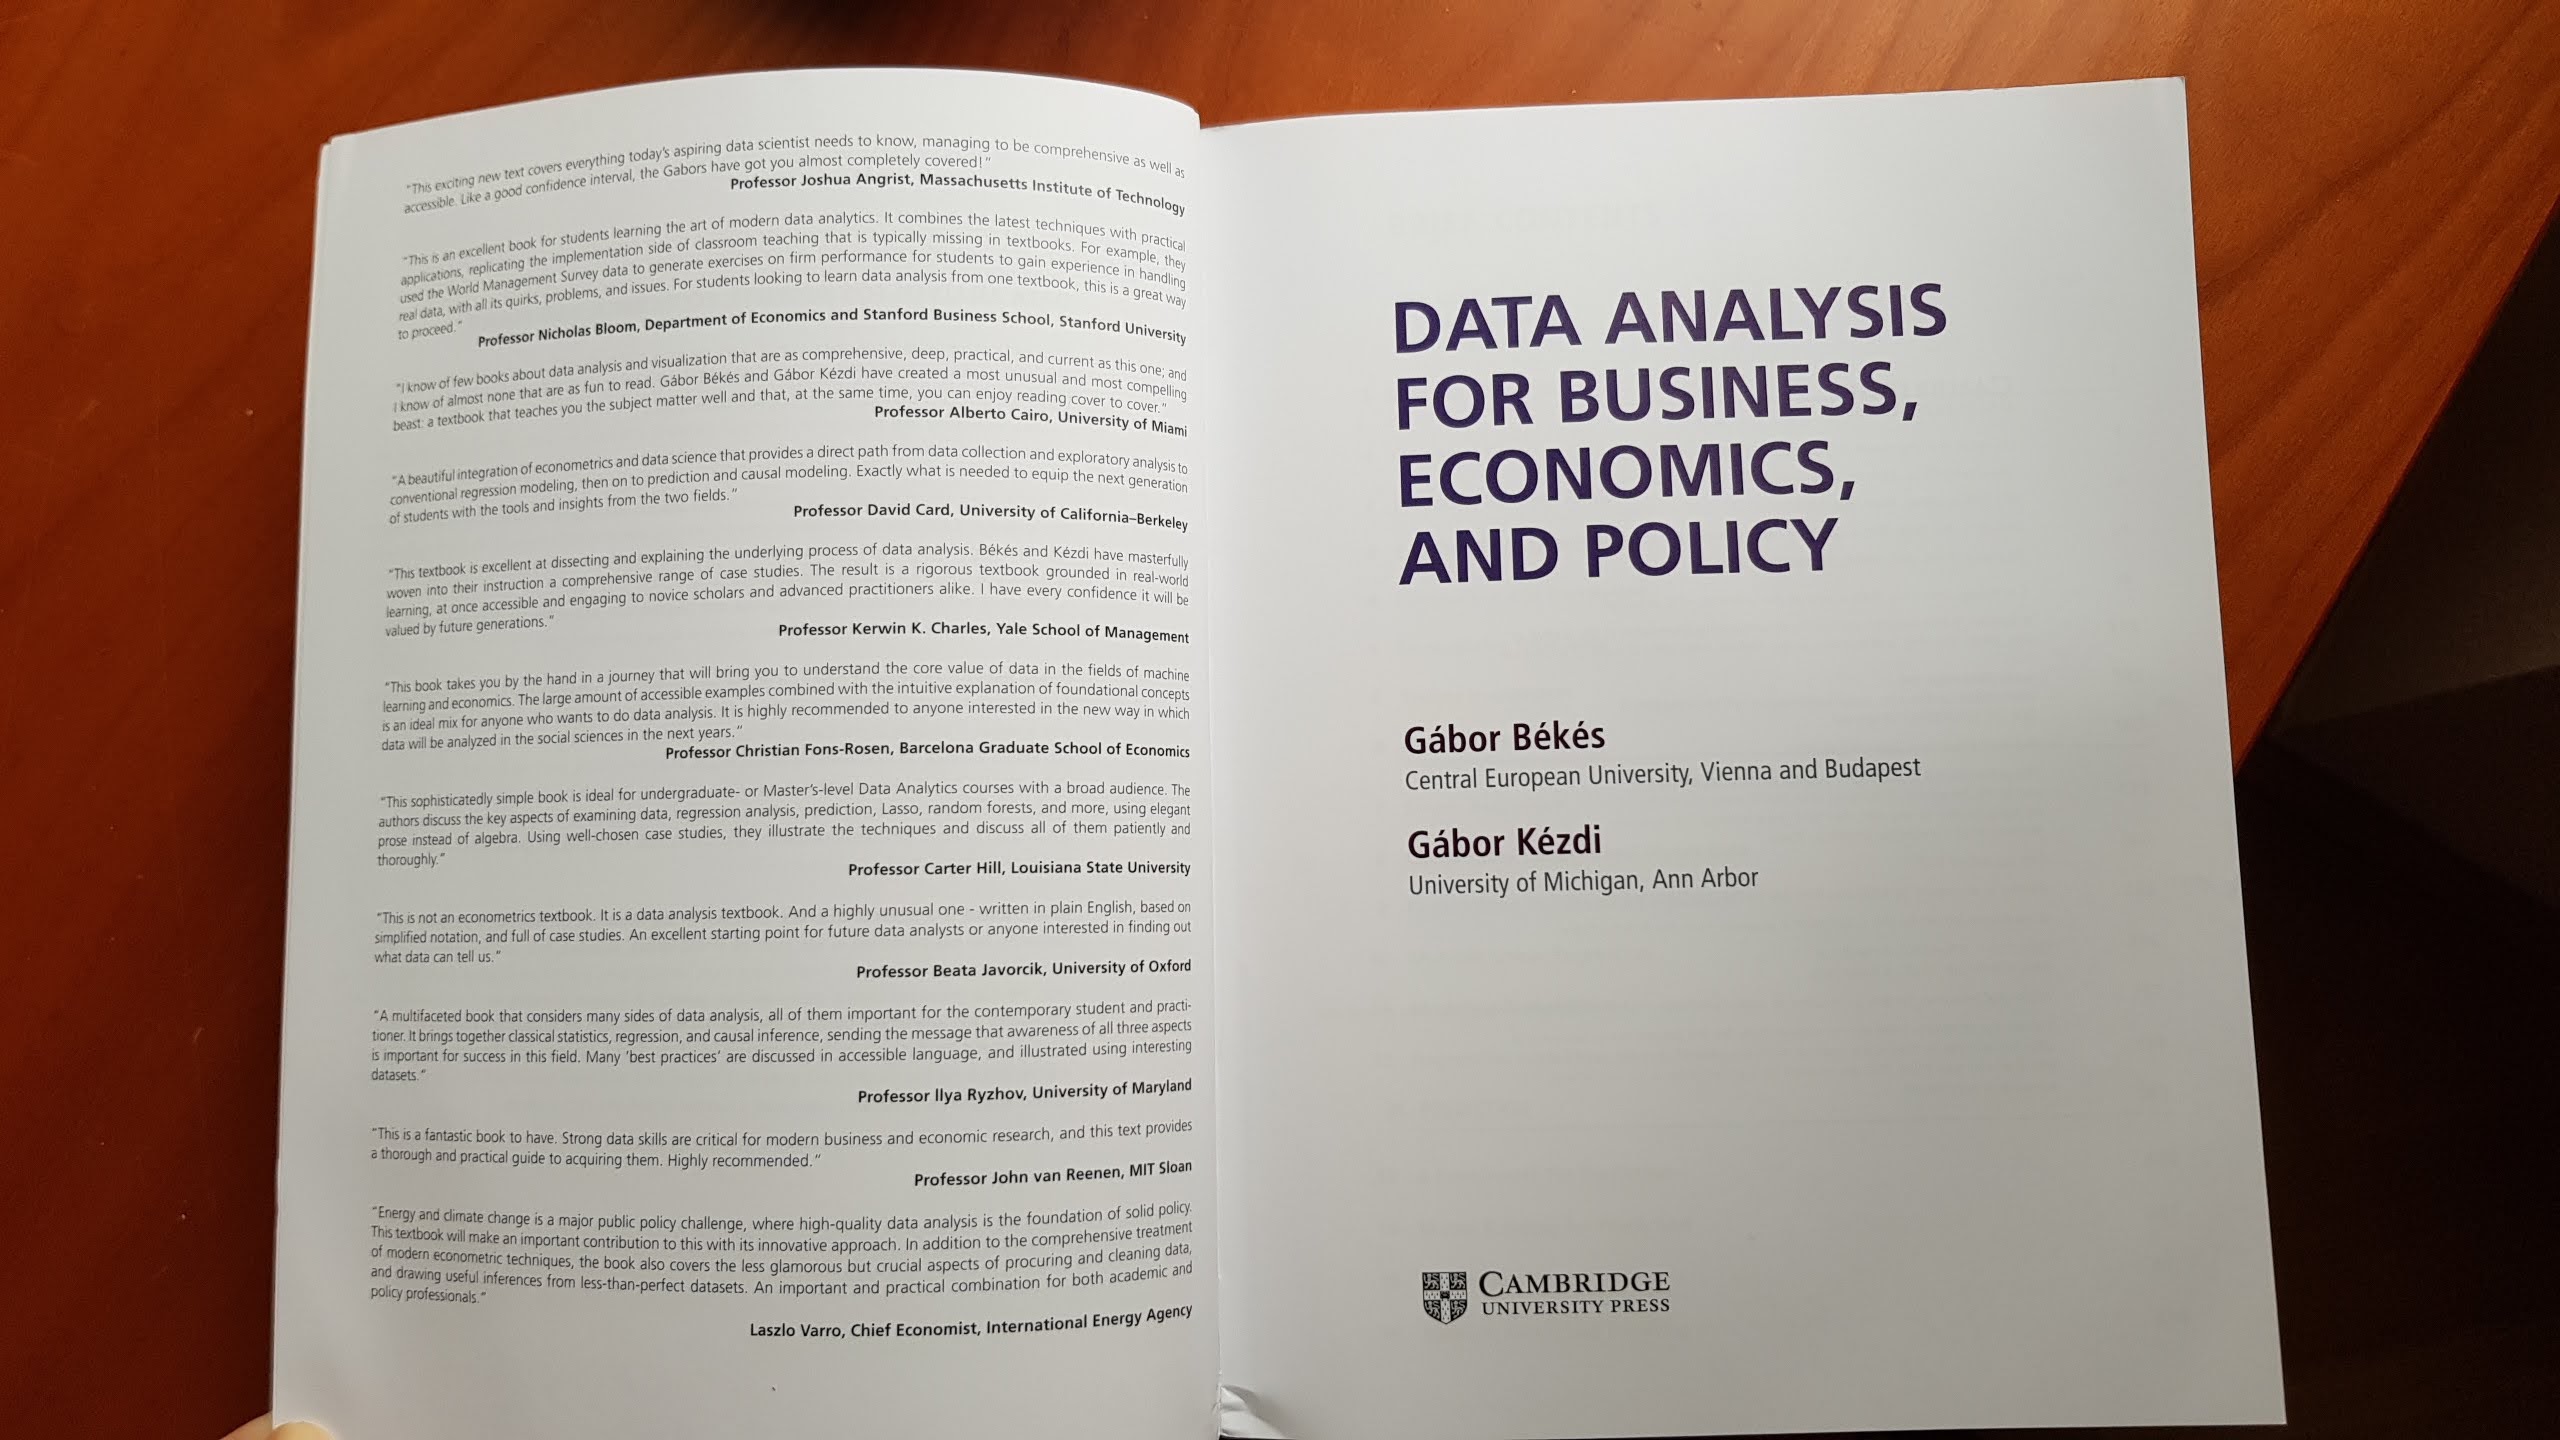
Our textbook equips future data analysts with the most important tools, methods and skills they need through the entire process of data analysis to answer data focused, real life questions. We cover all the fundamental methods that help along the process of data analysis. The textbook is divided into four parts covering data wrangling and exploration, regression analysis, prediction with machine learning, and causal analysis. We explain when, why, and how the various methods work, and how they are related to each other.
Our approach has a different focus compared to the typical textbooks in econometrics and data science. They are often excellent in teaching many econometric and machine learning methods. But they don’t give much guidance about how to carry out an actual data analysis project from beginning to end. Instead, students have to learn all of that when they work through individual projects, guided by their teachers, advisors, and peers – but not their textbooks.
To cover all of the steps that are necessary to carry out an actual data analysis project, we lean on a set of fully developed case studies. While each case study focuses on the particular method discussed in the chapter, they illustrate all elements of the process from question through analysis to conclusion. We facilitate individual work by sharing all data and code in Stata, R, and Python.

How the book is organized?
Our textbook focuses on the most relevant tools and methods. Instead of dumping many methods on the students, we selected the most widely used methods that tend to work well in many situations. That choice allowed us to discuss each method in detail so students can gain a deep understanding of when, why, and how those methods work. It also allows us to compare the different methods both in general and in the course of our case studies.
The textbook is divided into four parts. The first part starts with data collection and data quality, followed by organizing and cleaning data, exploratory data analysis and data visualization, generalizing from the data, and hypothesis testing. The second part gives a thorough introduction to regression analysis, including probability models and time series regressions. The third part covers predictive analytics and introduces cross-validation, LASSO, tree-based machine learning methods such as random forest, probability prediction, classification, and forecasting from time series data. The fourth part covers causal analysis, starting with the potential outcomes framework and causal maps, then discussing experiments, difference-in-differences analysis, various panel data methods and the event study approach.
When deciding on which methods to discuss and in what depth, we drew on our own experience as well as the advice of many people. We have taught Data Analysis and Econometrics to students in Master’s programs for years in Europe and the US, and trained experts in business analytics, economics, and economic policy. We used earlier versions of this textbook in many courses with students who differed in background, interest, and career plans. In addition, we have talked to many experts both in academia and in industry: teachers, researchers, analysts, and users of data analysis results. As a result, this textbook offers a curated content that reflects the views of data analysts with a wide range of experiences.
Learn through real case studies
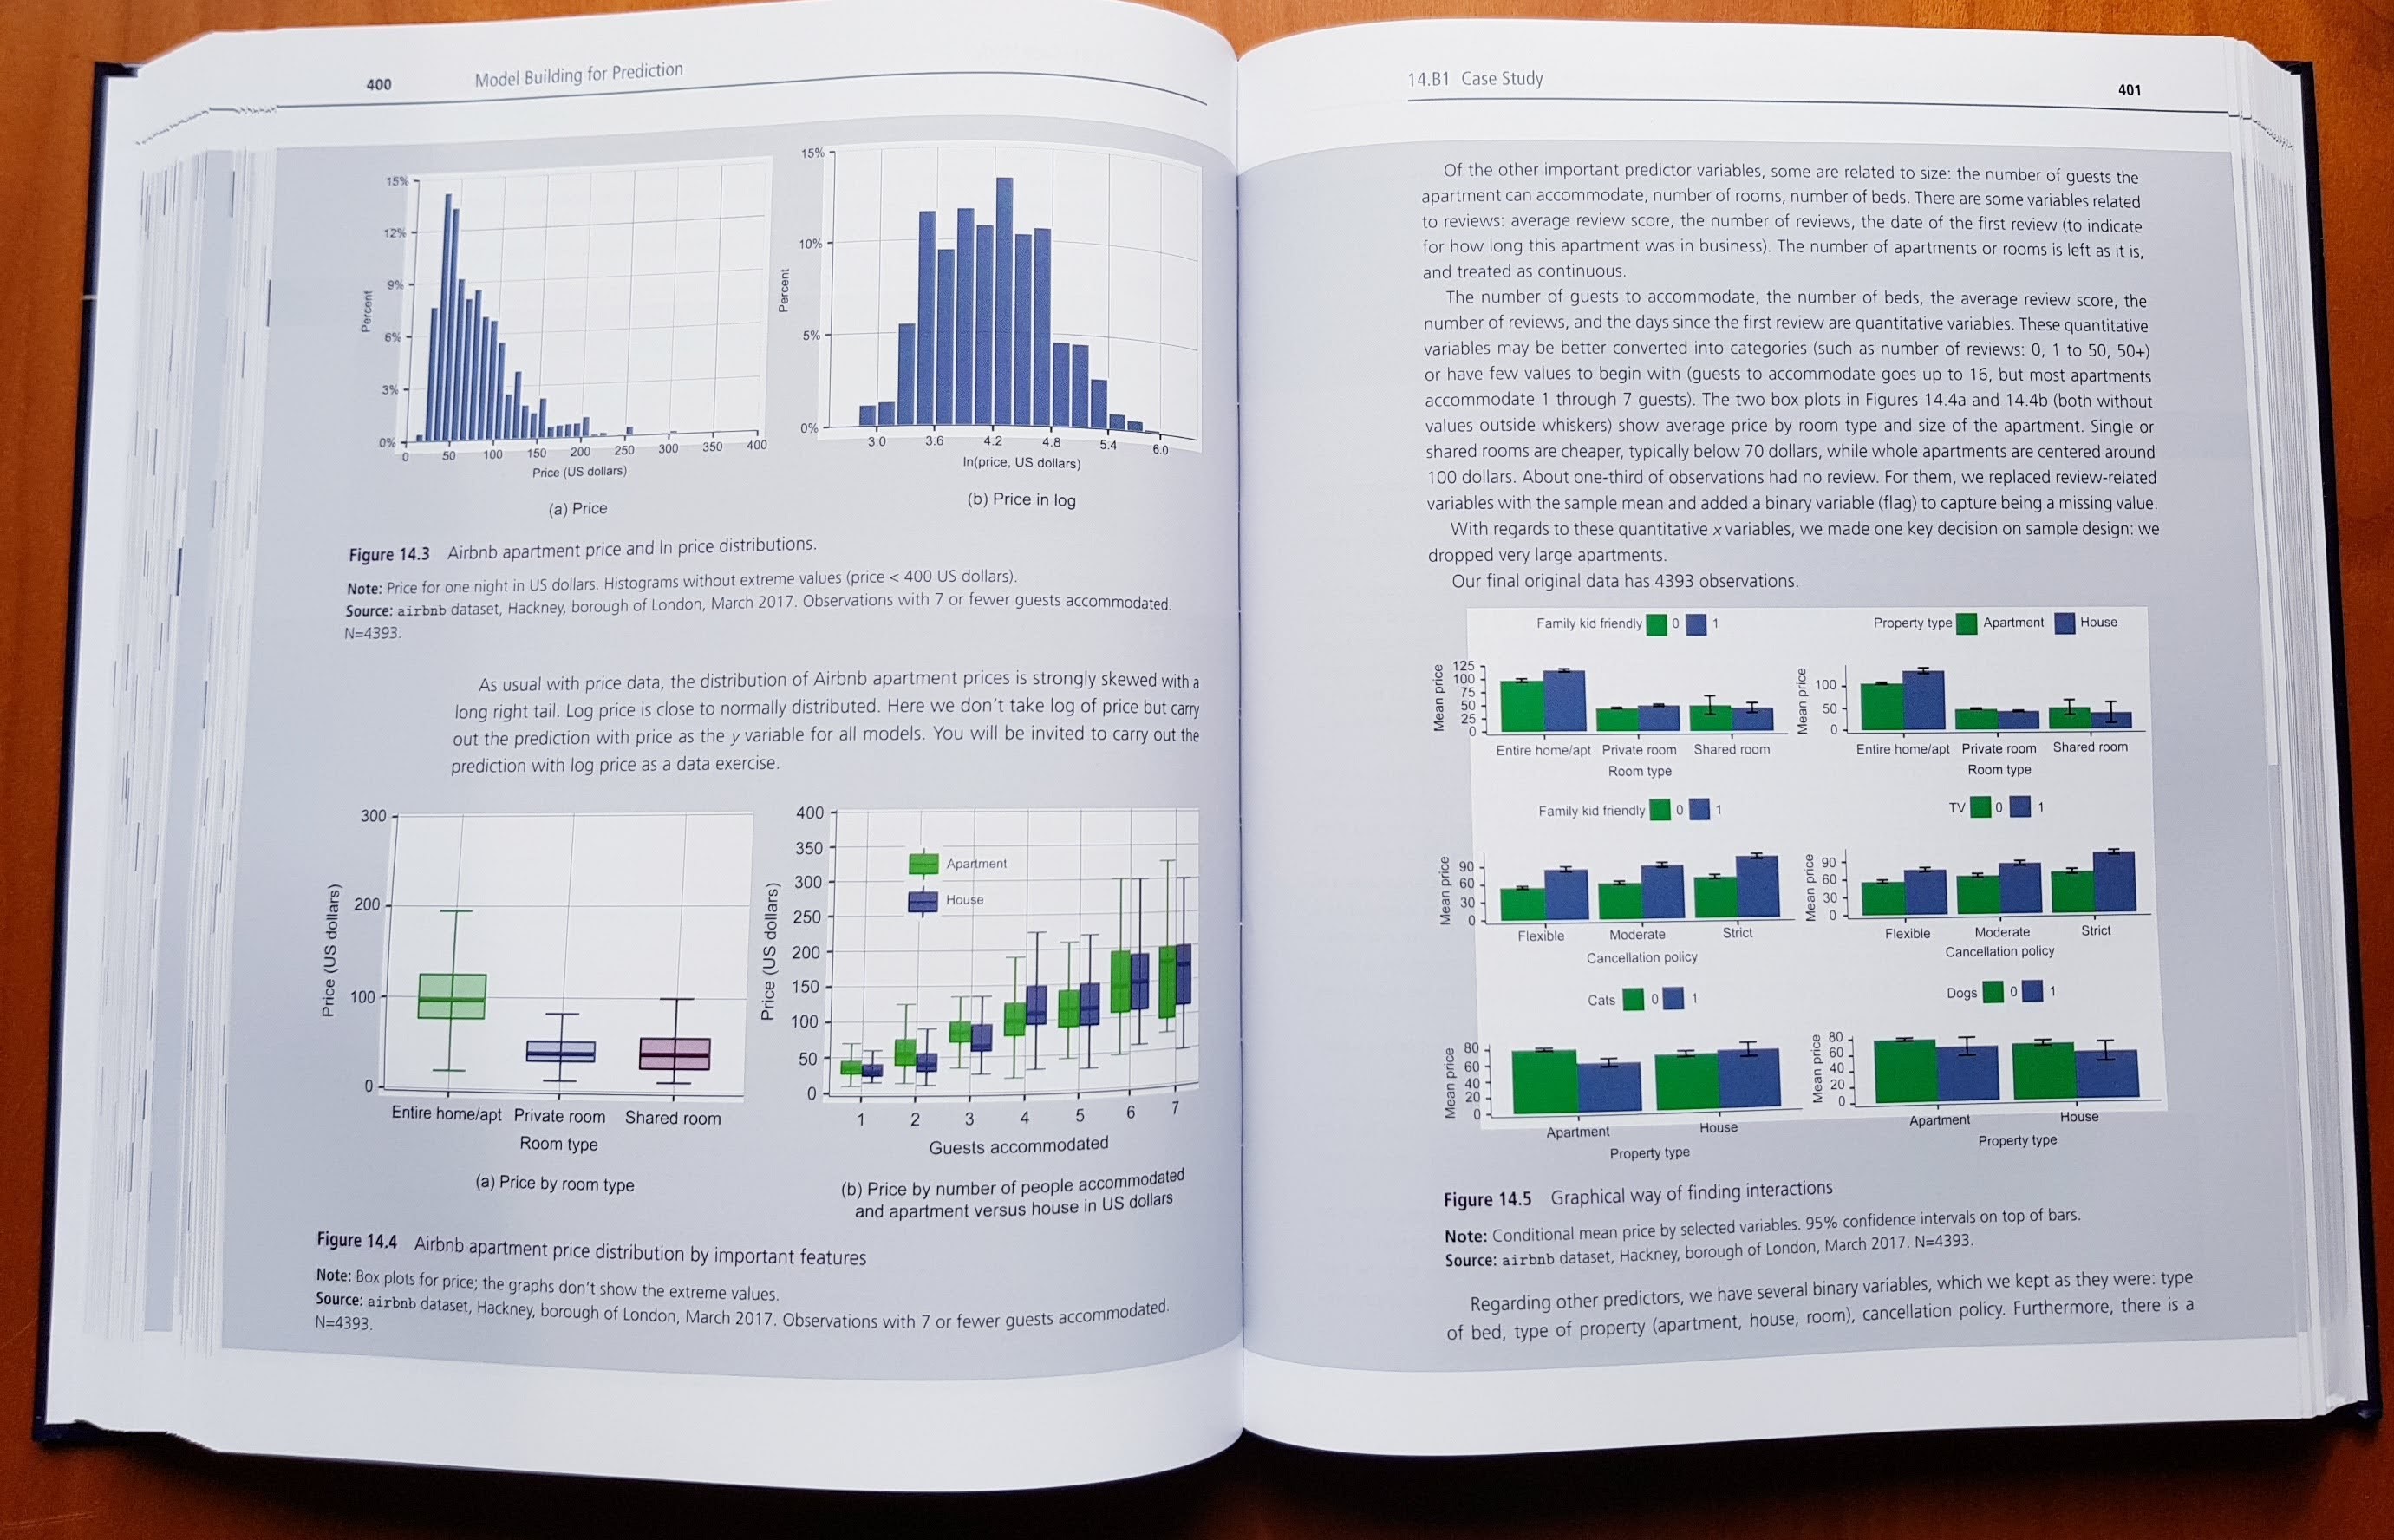
A cornerstone of this textbook are 47 case studies spreading over one-third of our material. This reflects our view that working through case studies is the best way to learn data analysis. Each of our case studies starts with a relevant question and answers it in the end, using real life data and applying the tools and methods covered in the particular chapter.

Similarly to other textbooks, our case studies illustrate the methods covered in the textbook. In contrast with other textbooks, though, they are much more than that.
Each of our case studies is a fully developed story linking business or policy questions to decisions in data selection, application of methods and discussion of results. Each case study uses real-life data that is messy and often complicated, and it discusses data quality issues and the steps of data cleaning and organization along the way. Then, each case study includes exploratory data analysis to clarify the context and help choose the methods for the subsequent analysis. After carrying out the main analysis, each case study emphasizes the correct interpretation of the results, effective ways to present and visualize the results, and many include robustness checks. Finally, each case study answers the question it started with, usually with the necessary qualifications, discussing internal and external validity, and often raising additional questions and directions for further investigation.
Our case studies are different also because they cover a wide range of topics, with a potential appeal to a wide range of students. They cover consumer decision, economic and social policy, finance, business and management, health, and sport. Their regional coverage is also wider than usual: one third is from the U.S.A., one third is from Europe and the U.K., and one third is from other countries or includes all countries from Australia to Thailand.
Support material with ready-to-use data and code
We offer a truly comprehensive material with data, code for all case studies, 360 practice questions, 112 data exercises, derivations for advanced materials and reading suggestions. Each chapter ends with practice questions that help revise the material with a focus on theory. They are followed by data exercises that invite students to carry out analysis on their own, in the form of robustness checks or replicating the analysis using other data.
We share all raw and cleaned data we use in the case studies. We also share the codes that clean the data and produce all results, tables, and graphs in Stata, R, and Python so students can tinker with our code and compare the solutions in the different software.
All data and code are available here
Who is this book for?
This textbook was written to be a complete course in data analysis. It introduces and discusses the most important concepts and methods in exploratory data analysis, regression analysis, machine learning and causal analysis. Thus, readers don’t need to have a background in those areas.
The textbook includes formulae to define methods and tools, but it explains all formulae in plain English, both when a formula is introduced and, then, when it is used in a case study. Thus, understanding formulae is not necessary to learn data analysis from this textbook. They are of great help, though, and we encourage all students and practitioners to work with formulae whenever possible. The mathematics background required to understand these formulae is quite low, at the the level of basic calculus.
This textbook could be useful for university students in graduate programs as core text in applied statistics and econometrics, quantitative methods, or data analysis. The textbook is best used as core text for non-research degree Masters programs or part of the curriculum in a Phd or research Masters programs. It may also complement online courses that teach specific methods to give more context and explanation. Undergraduate courses can also make use of this textbook, even though the workload on students exceeds the typical undergraduate workload. Finally, the textbook can serve as a handbook for practitioners to guide them through all steps of real-life data analysis.
Advice from Hal Varian
Hal Varian has been the chief data scientist at Google, but before he wrote on of the best and most popular textbooks in Economics.
“If you are looking for a career where your services will be in high demand, you should find something where you provide a scarce, complementary service to something that is getting ubiquitous and cheap. So what’s getting ubiquitous and cheap? Data. And what is complementary to data? Analysis. So my recommendation is to take lots of courses about how to manipulate and analyze data: databases, machine learning, econometrics, statistics, visualization, and so on.”
