Learning to code for data analysis
Here is some tip and advice on how to learn coding.
NEW! Neu! Nuevo! Új! Nouveau! Our own coding courses
Well, well, well. We are developing coding courses to go along with the matreial in the book.
The courses serve as an introduction to the R/Python/Stata programming languages and software environments for data exploration, data munging, data visualization, reporting, and modeling.
- Coding for Data Analysis with Rstats - first version out
- Coding for Data Analysis with Python - first version soon
- Coding for Data Analysis with Stata - in development
Big picture
A well respected resource that introduces thinking about coding for data analysis is Code and Data for the Social Sciences: A Practitioner’s Guide by Matthew Gentzkow and Jesse M. Shapiro. They talk about issues like replication, organization of a project, or version control.
Learning to code for data analysis
R
There are two popular toungues (beyond base) in R, called data.table and tidyverse. We use tidyverse.
There are great many resources, to learn R for data analysis.
The best start is our brand new course: Coding for Data Analysis in R. It offers a complete course to go along with the first twelve chapters of Data Analysis. Classes with code, learning outcomes, exercises. Pretty cool.
To learn R, here are some oher ideas:
- To learn tidyverse, you may start with the wonderful book by Hadley Wickham and Garrett Grolemund R for Data Science.
- A wonderful intro, with a focus on starting R and data wrangling, is by Jenny Briant’s Data wrangling, exploration, and analysis with R course, aka STAT545.
- U Cincinatti has a very nice guide with discussions on basics, workflow, manipulation in R Programming Guide.
- At CMU, Alexandra Chouldechova has a nice programming in R materials.
- A great online course is by Roger Peng, Jeff Leek and Brian Caffo R programming onCoursera
- At Data Carpentry, François Michonneau and Auriel Fournier has a fantastic content –Data Analysis and Visualization in R for Ecologists.
- Grant McDermott has a more advanced lecture series with amazing content Data Science for Economists.
- Working with time series is hard. A great resource by Hansjörg Neth: Data Science for Psychologists Chapter 10 Dates and times.
- What They Forgot to Teach You About R, awesome material by Jennifer Bryan and Jim Hester. workshop material.
- Great style guide with suggestions on coding by Sean Higgins. R guide.
- Nice, dplyr focused intro into called An introductory workshop on modern data analyses and workflows by folks at Aarhus, available as Reproducible Research in R
- A list of useful stuff: Hacks,
- Very nice intro to R is the R introduction by Hans H. Sievertsen in Bristol, UK. Coolness in shinyapps!
Stata
There are many great materials, here is some we like:
- UCLA extensive material at UCLA IDRE Stats.
- Amazing two part series by Kurt Schmidheiny Part 1 Part 2
- At Data Carpentry, CEU’s Miklós Koren and Arieda Muco are developing a Stata course for Economist.
- A Stata cheatsheat.
- One of the greatest, coolest somewhat advanced Stata resource is the Medium site of Asjad Naqvi The Stata Guide that includes pearls like Stata and Github integration
Python
Python is a general purpose language, used for many applications beyond data science/statistics. There are great many resources, to learn Python for data analysis. Here are some ideas:
- Very nice courses are available widely, for instance on Datacamp, and Codeacademy.
- A set of very nice lessons at Python for Everybody.
- NYU has a great group also offering a Python cours by QuanEcon.
- Great style guide with suggestions on coding by Sean Higgins. Python guide.
- Great intro book and material by Allen B. Downey to Think Python –How to Think Like a Computer Scientist
- A great online book by Arthur Turrell Coding for Economists – a guide for (not only for) economists on what programming is, why it’s useful, and how to do it.
- Al Sweigart, 2019 (2nd ed) Automate the Boring Stuff with Python, 2nd Edition
Data visualization
- The Data-to-Viz project is a classification of chart types based on input data format. Created by Yan Holtz, it is a phenomenal educational and practical tool. Importantly, it is linked to
- R graph gallery to show how to do graphs with
ggplot2 - Python Graph gallery to show to do it with
matplotlibandseaborn
- R graph gallery to show how to do graphs with
- For Stata users, one of the best resource is the Medium site of Asjad Naqvi The Stata Guide
- Another piece by Asjad: code for 30 different graphs
- The World Bank has nice Visual Libraries collection for R and Stata users, mostly on impact evaluations. It comes with
- The Jpal Poverty Action Lab, a scientific/ policy analyis NGO has a research guide with a very nice data vizualization guide. It lists useful commands in Stata and R
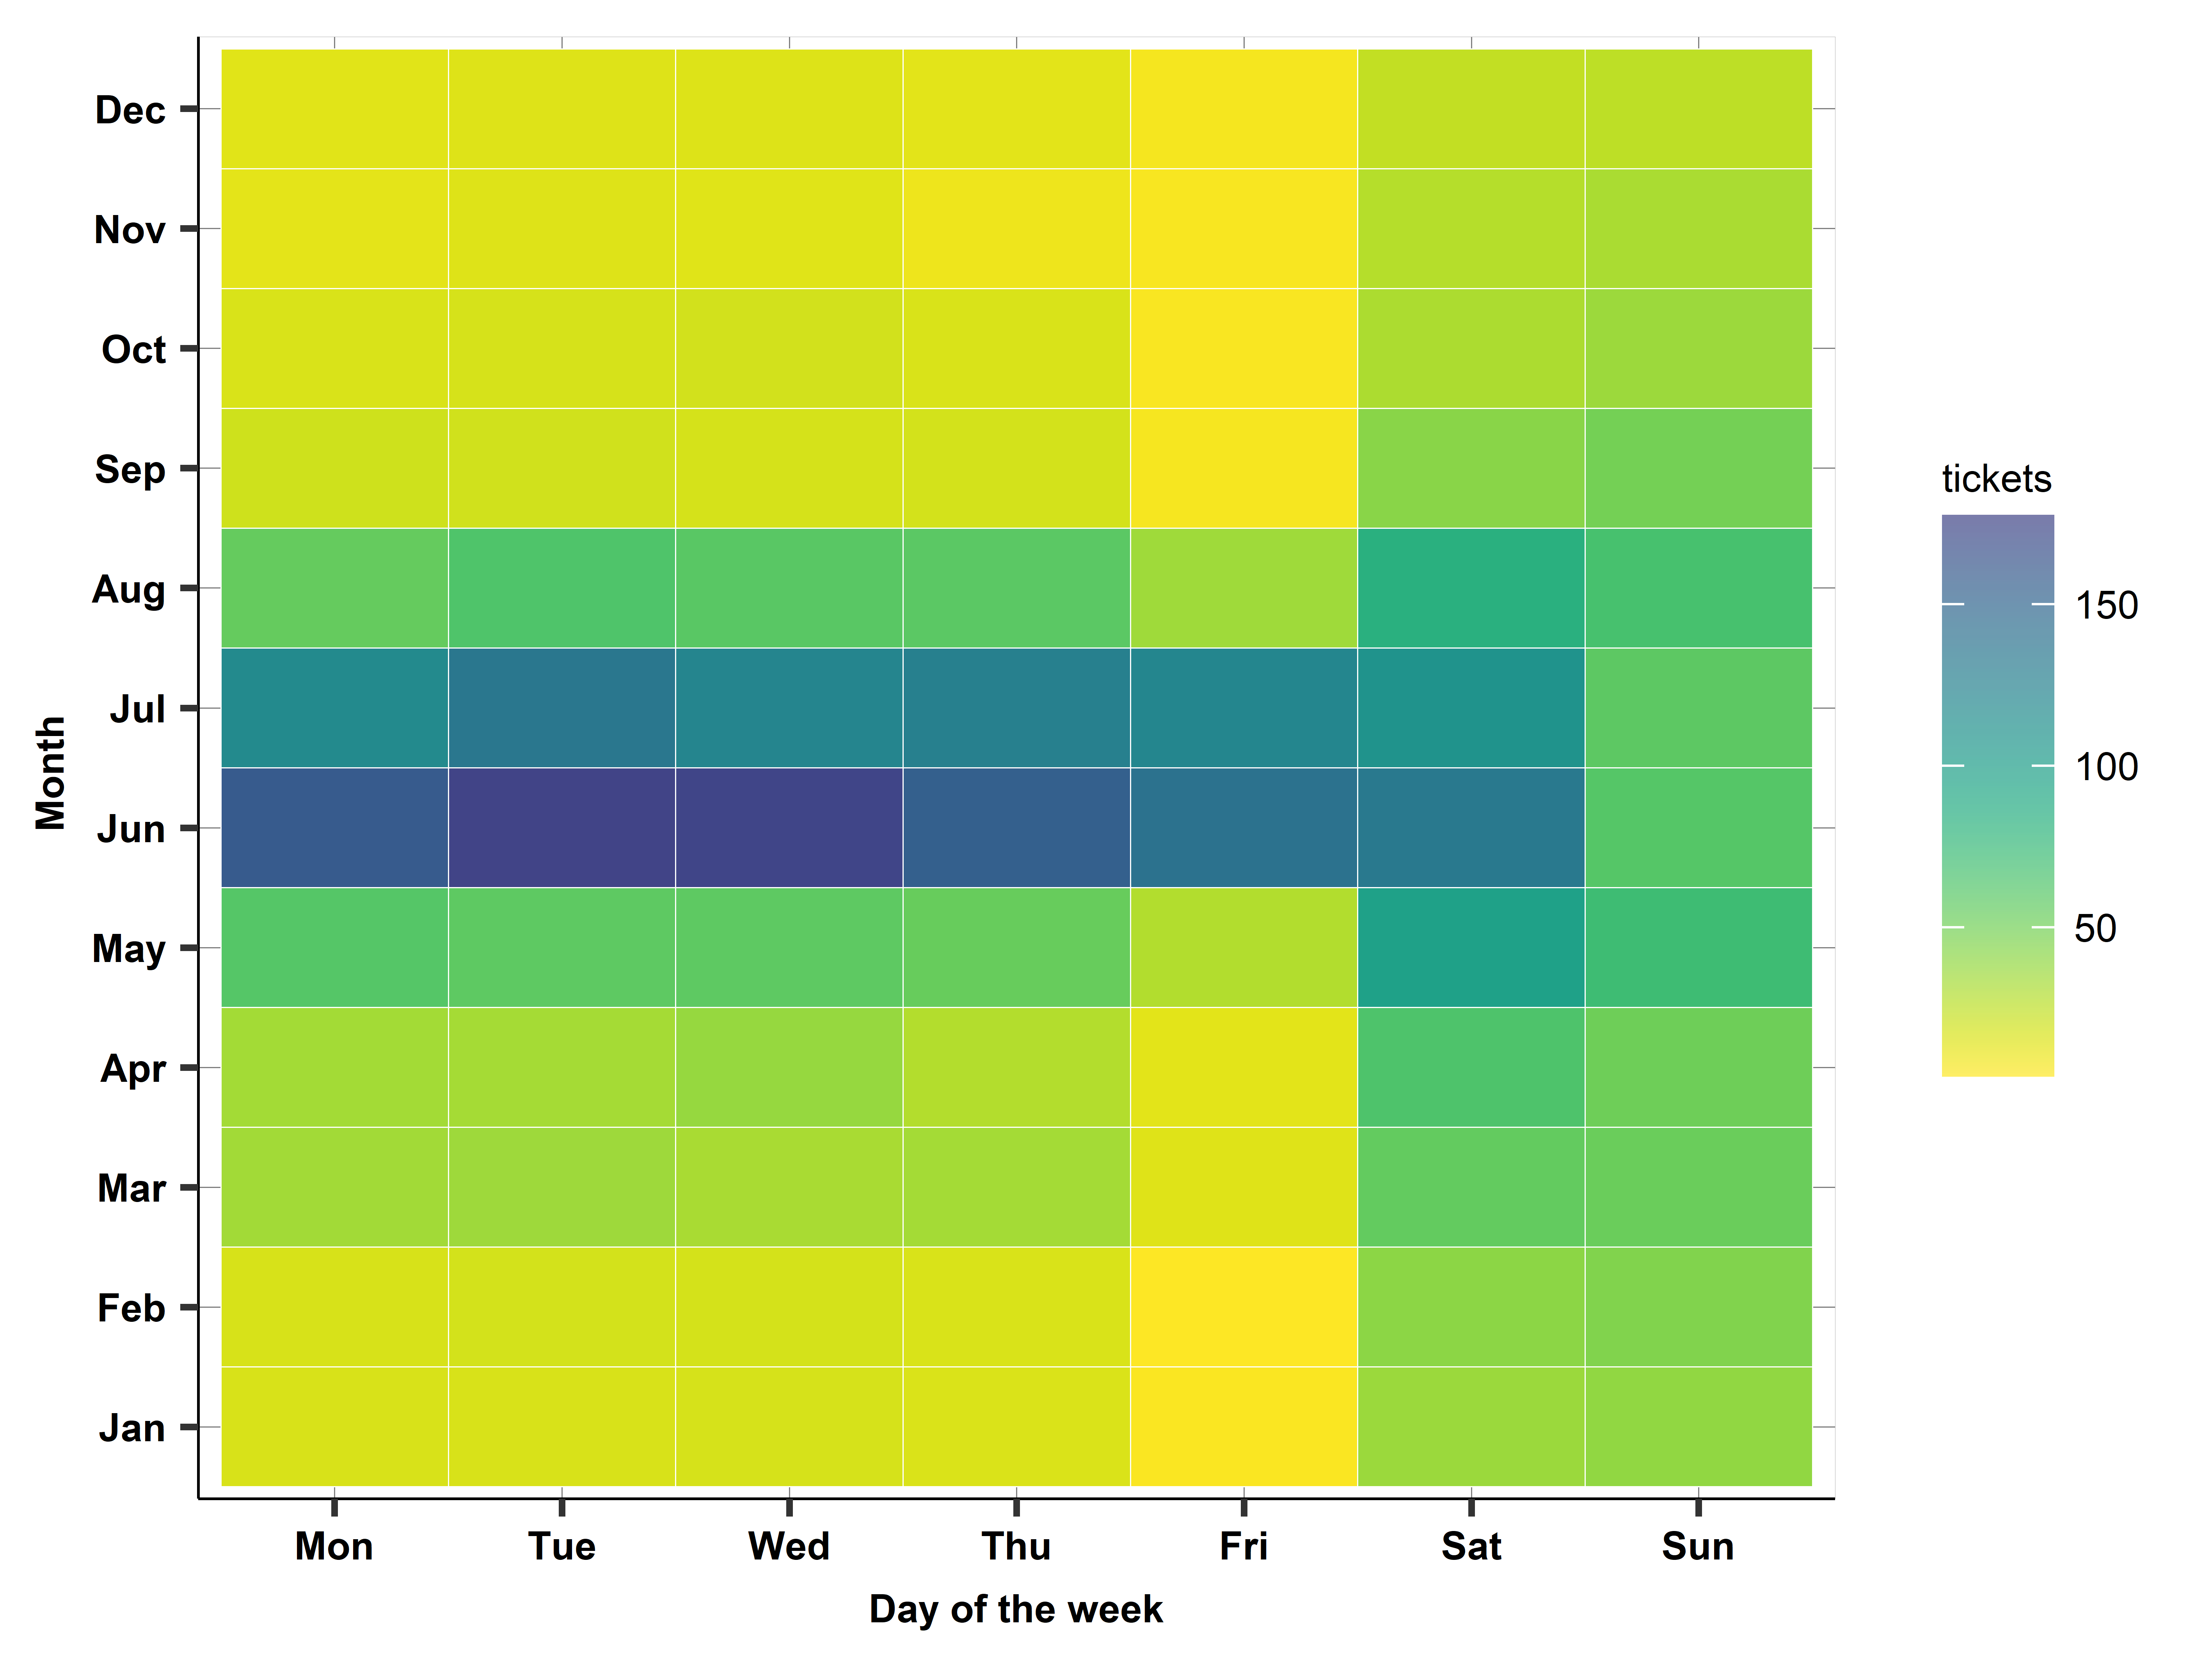
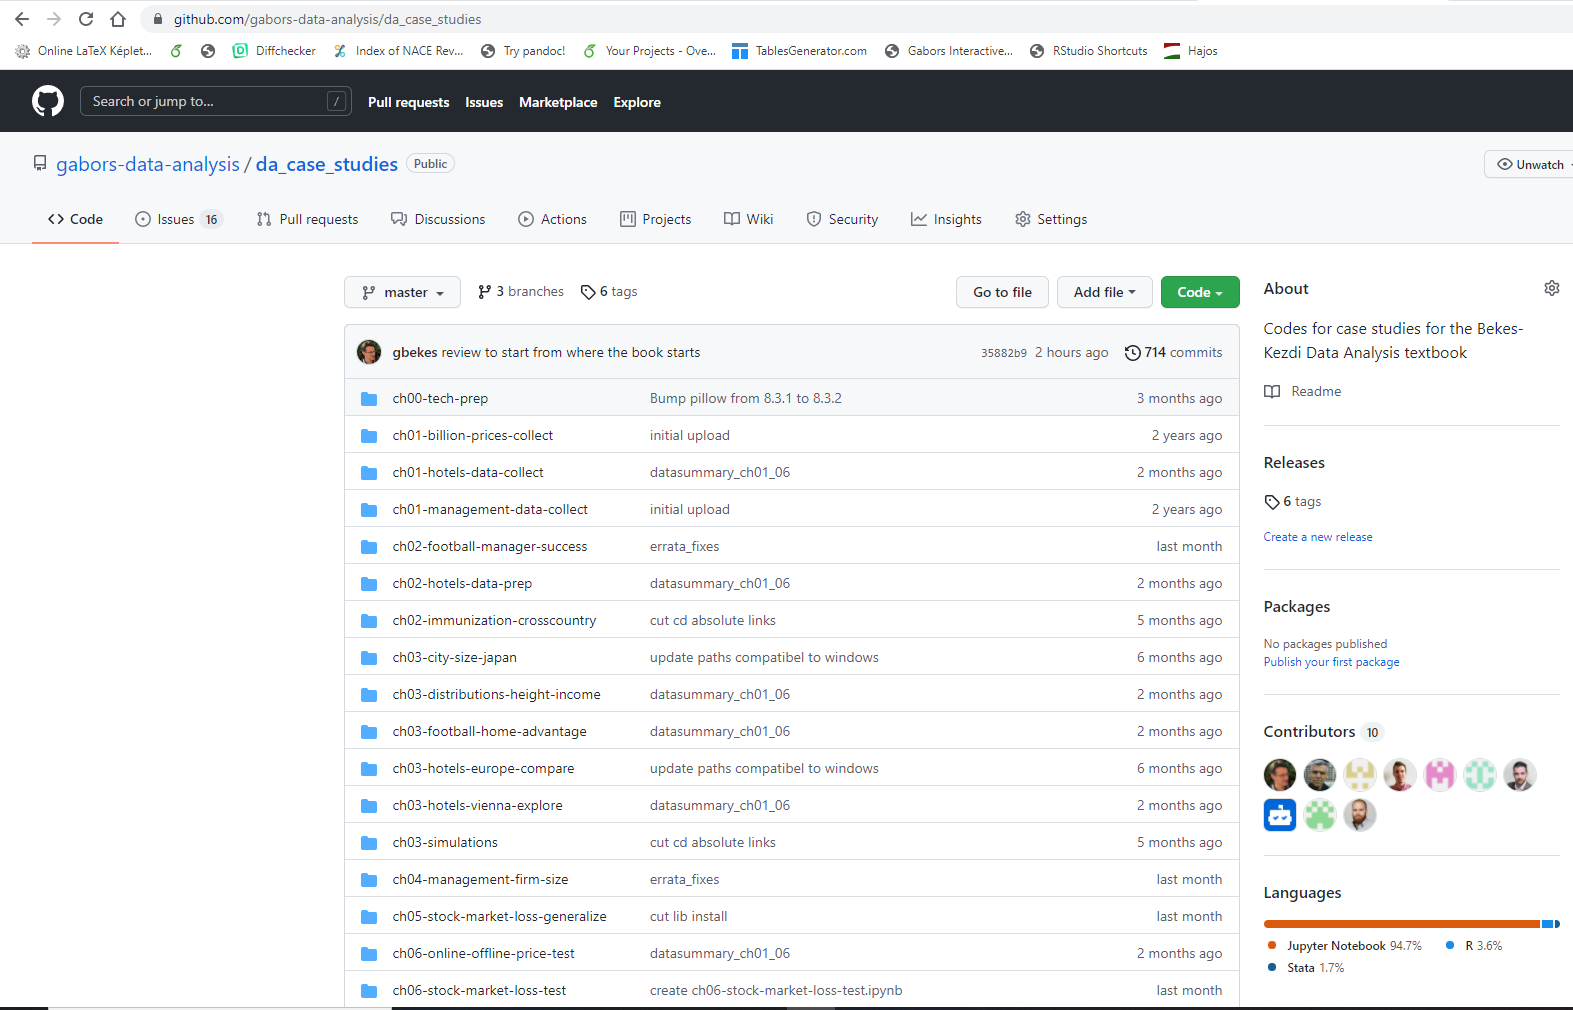
- Check out the codebase for the textbook at Gabors Data Analysis Github page to see graphs like this (chapter 18):

Learning a second language
Some people have experience using one language but would now learn a second one. Some ideas we found useful:
Check out the texbook’s Github and compare
Check out the codebase for the textbook at Gabors Data Analysis Github page
Take an example: management quality and firm size, descriptive statistics
- in R with
tidyverse/dplyr,modelsummaryandggplot - in Stata with
tabstat,twoway scatter - in Python with
pandasandplotnine/ggplot

R for Stata users
In Economics and many other social sciences, we use Stata for research, and learnt R or Python as a second language. Here are some links and tutorials we found useful.
- Matthieu Gomez has a wonderful intro to R for Stata users . For instance the bit on regressions is pretty useful, I come back to it regularly.
- John Ricco has a short intro to basics of data wrangling
- Nick Huntington-Klein, Grant McDermott and Kyle Butts collaborate for a new (2021) and superb transition resource From Stata to R, like check this out on cleaning. A key position I love is building with a few pacakges only!
R to/from Python
For this textbook, Stata and R code were developed early on, and we started to work on Python code set only after the proof was ready. Some ideas we (and our RAs) found useful
- GGplot for Python by Monash
- Pandas and tidyverse
- A new textbook, Foundations of Statistics for Data Scientists by Alan Agresti and Maria Kateri has a very expansive code support in R, Python
Python for Stata users
- Adam Ross Nelson (2020) Going From Stata to Pandas – a longer post on Medium
More translations
- To even more translations across languages, check out Library of Statistical Techniques – LOST is a publicly-editable website with the goal of making it easy to execute statistical techniques in statistical software. This is a project by Nick Huntington-Klein but we can all contribute now, as many people has done. Furthermore check out the Github page for Nick’s excellent causality book, also on all three languages.
More resources
- Great list of data tools by the UC Berkeley Library and Research IT run Research Data Management (RDM) Program
- Oxford University’s Center for the Study of African Economies runs Coders Corner - a collection of coding help on many topics. Mostly Stata, but some R, Python (and Matlab)
More useful bits
- Data project structure, names by Danielle Navarro
Help us expand this bit
So if you are here, you have scrolled through. Maybe you thought, why don’t you have X. Well, please share ideas with HERE. Cheers.
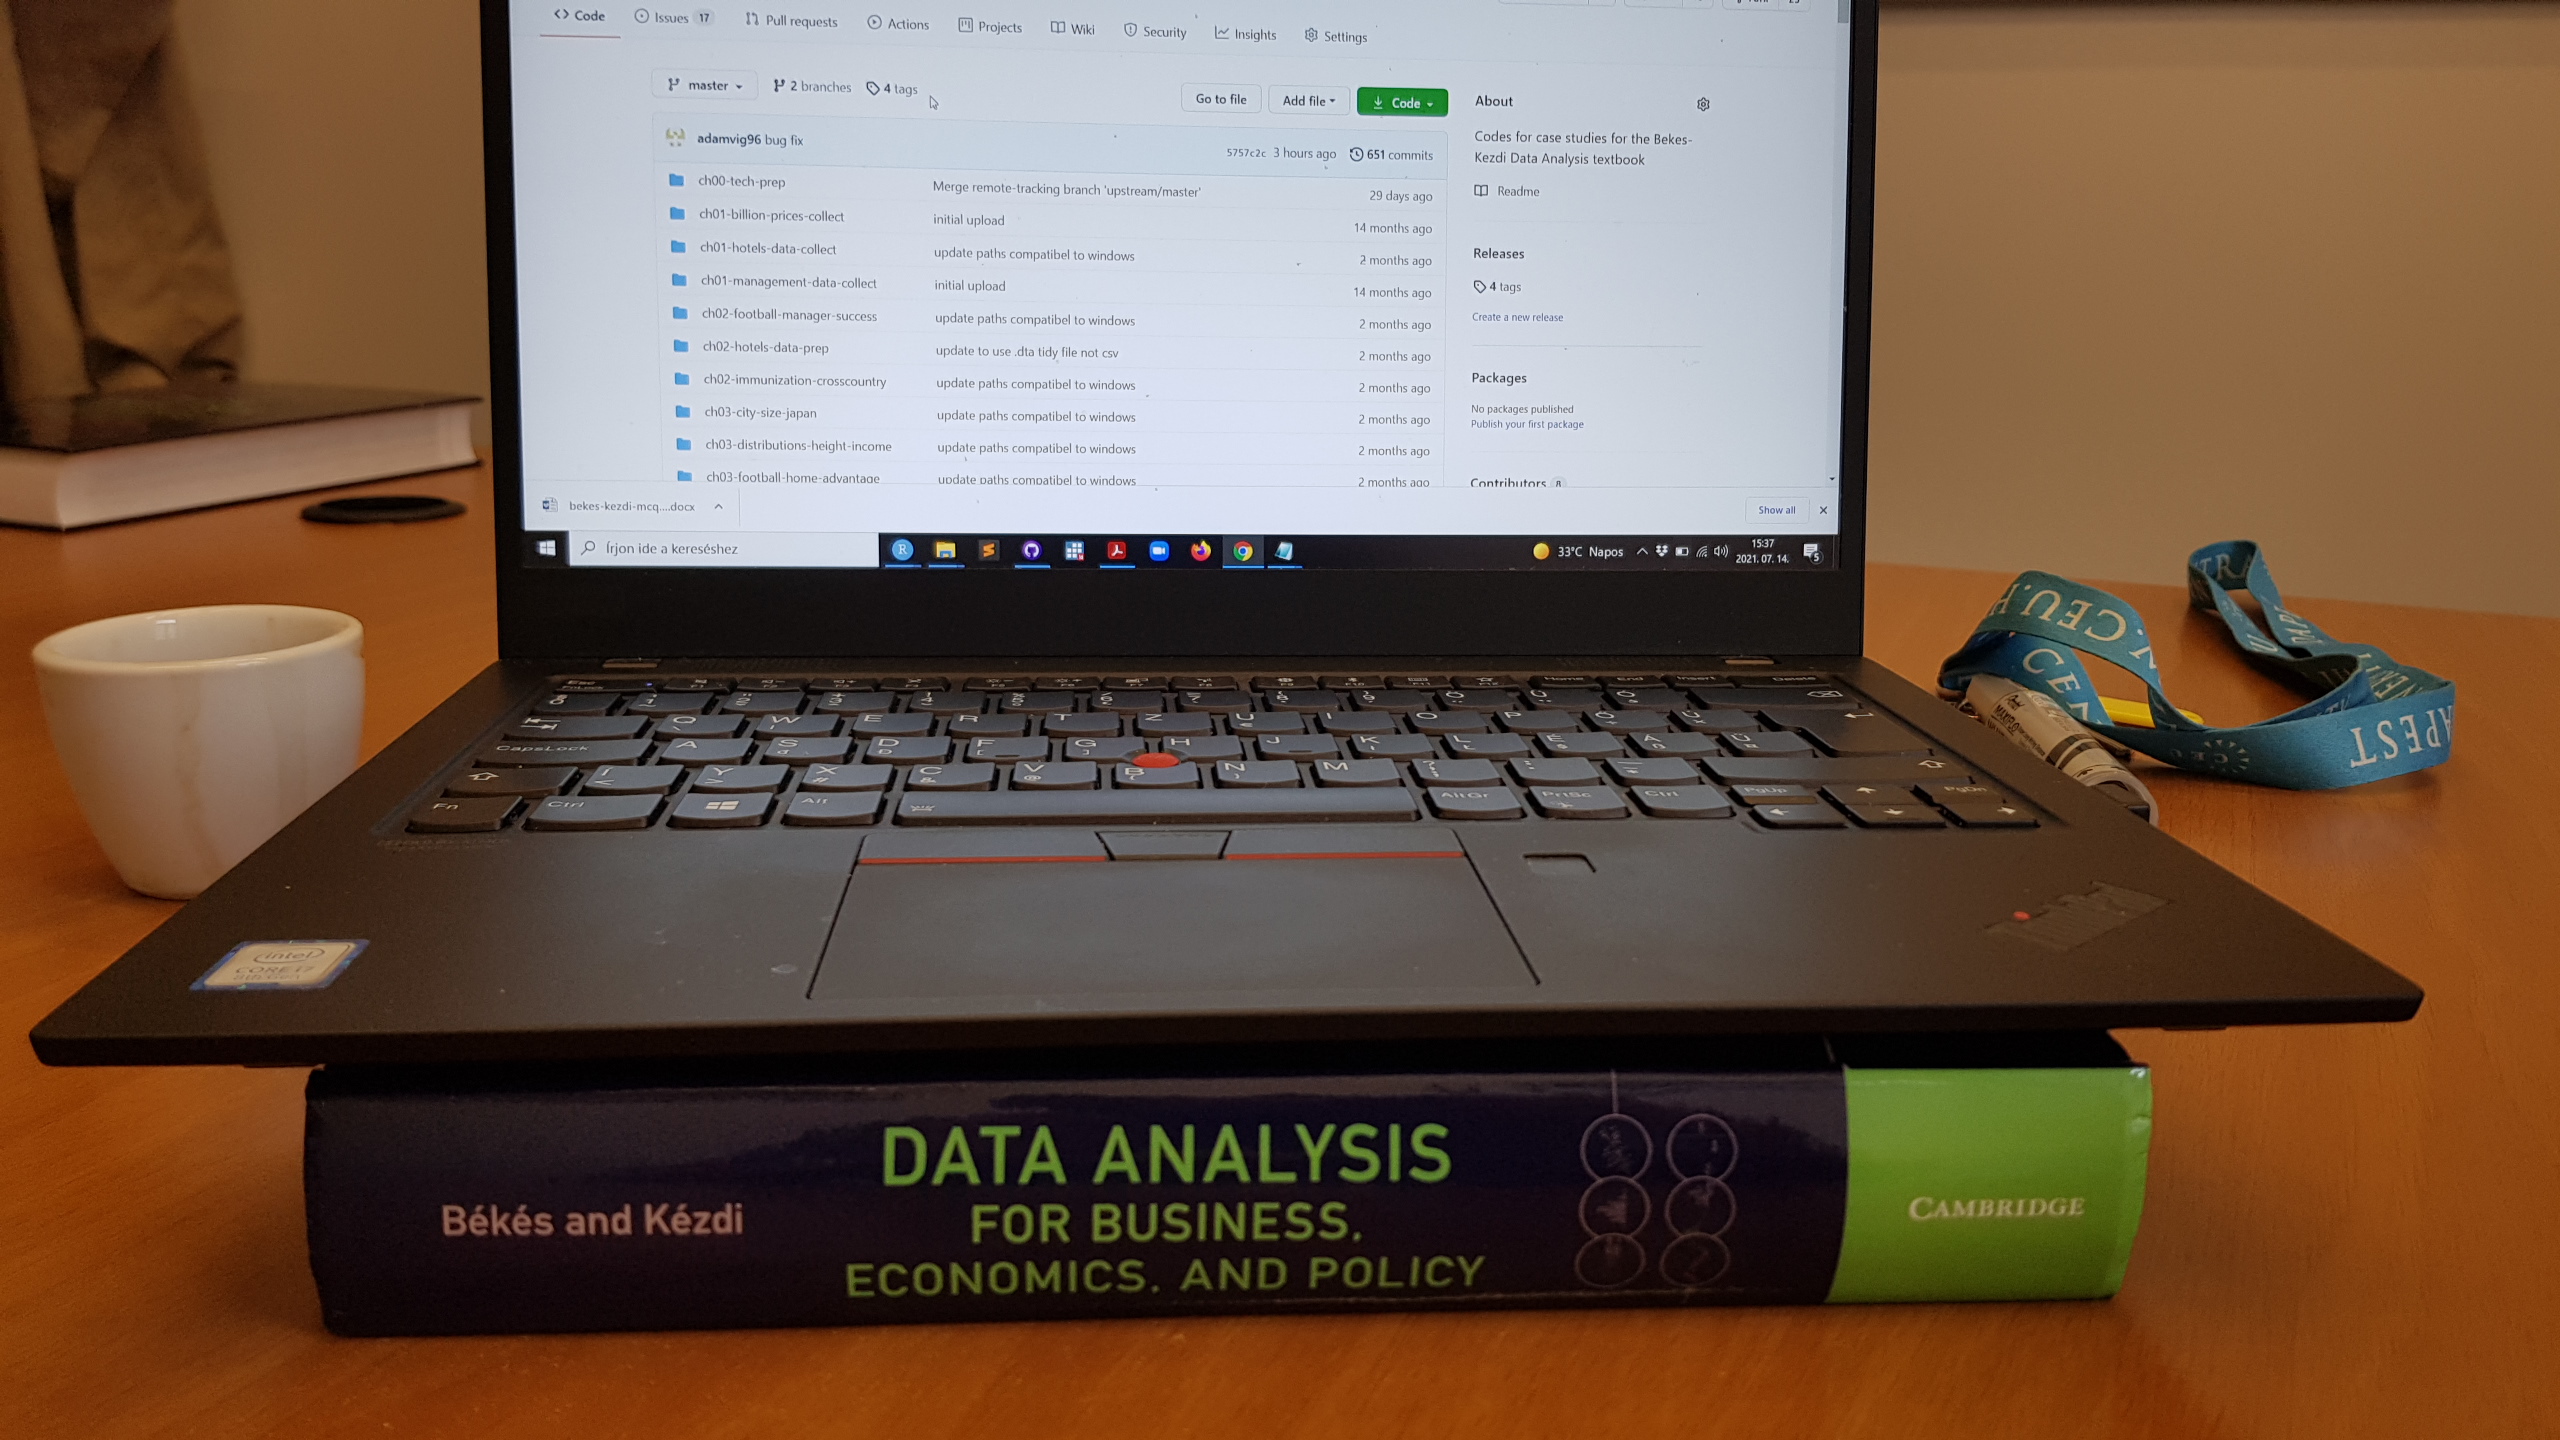
Also, check out the book that holds up the code!
