On picking the Viridis color scheme
The economist meets visual arts
About two years ago, we had to make final decision about how the graphs in the textbook will loook like. I am an economist, and well, I know about ten colors. I have had no idea what a hue means. I did not really know what a color scheme was.
Then, two things happen. First TV shows about interior design with their discussion of color schemes. My fav show has been BBC’s The Great Interior Design Challenge. This is when I first learnt that what I color blueish green is actually teal. And that there sooo many different shades of a color. Heard about the idea of color palettes and schemes, too.
Second, we had a serious discussion with Gabor K - he is partially color blind (as are about 6% of population) on what he may and may not see. Red and green, not an option. So we needed to decide on how we use colors, and we were set to pick two good looking, color-blind friendly colors. To get started, I talked to my dataviz mentor, Alberto Cairo, who showed me a great application, called Color Oracle that will pinpoint if an image works for color blind folks.
Then, I visited my editors in Cambridge, and I also met technical people, who told me that there are no more 2 or 3-color books, it is either a single color or full color. So if we wanna have colors, we can have as many colors as we’d like. Awesome.
So the summary of all this is that we realized, we can have many colors, but not any colors. And we need a scheme. So we tried to pin down our needs:
- For some graphs, we would need many colors not just a few
- We want to use colors to represent values on a less-more (few-many) scale
- Color blind folks should see them all right
- Bonus: a black and white copy shall work, ie light and dark instead of some colors.
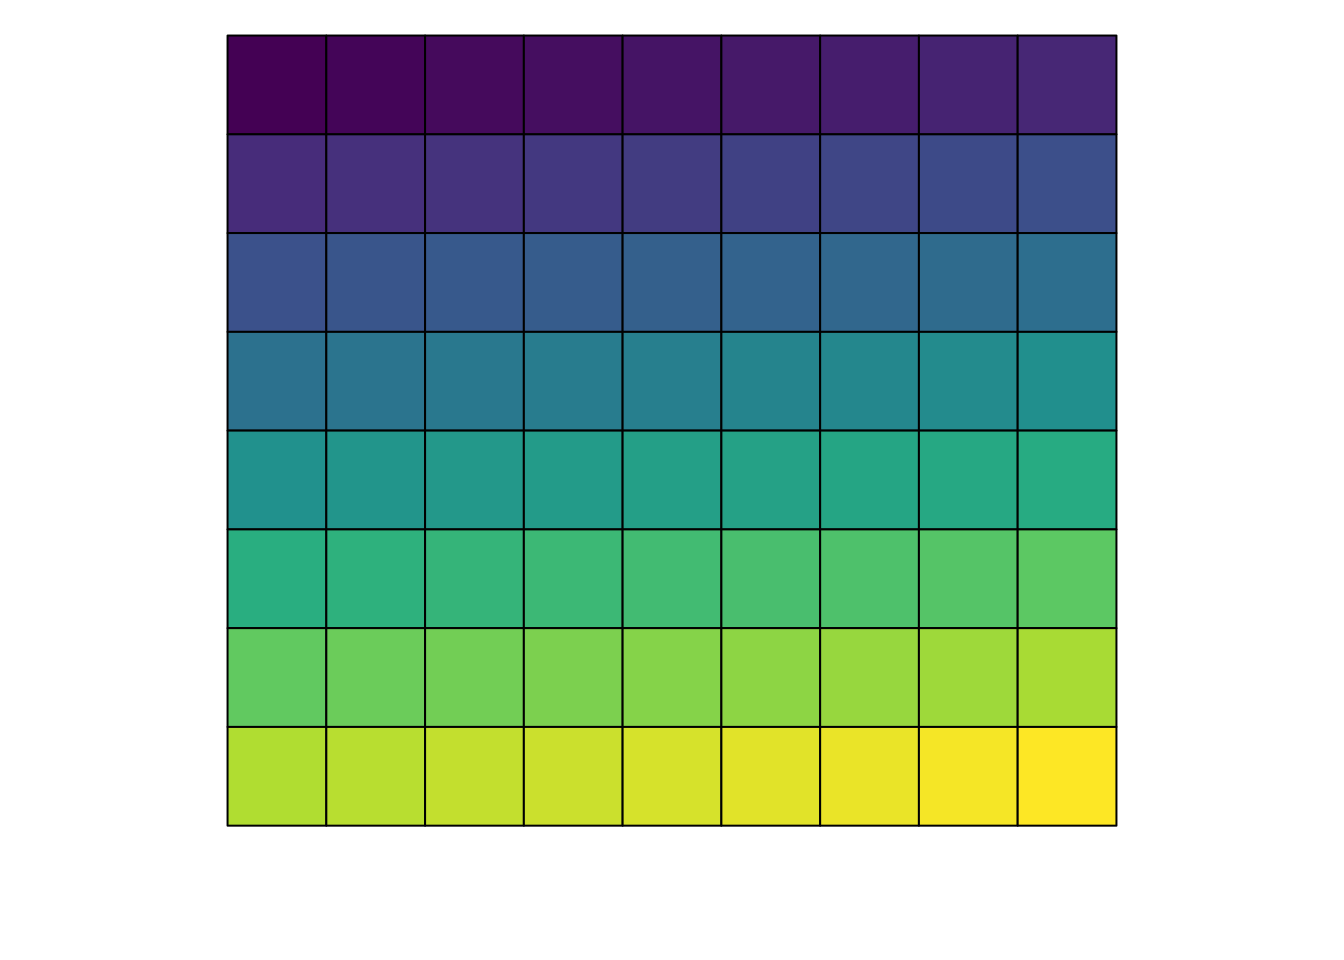
Viridis to the rescue
I searched around untill I found a wonderful video on Viridis. This is a conference talk at SciPy2015 by Nathaniel Smith and Stéfan van der Walt. In less than 20 minutes, it explained how vision works, what could go wrong and why viridis is a solution. Viridis is a scheme first developed for Matplotlib in Python, but now available in R and Stata as well.
When we needes a set of pre-defined colors for scatterplots or line graphs we picked 5 colors from the scheme (here with their HEX code)
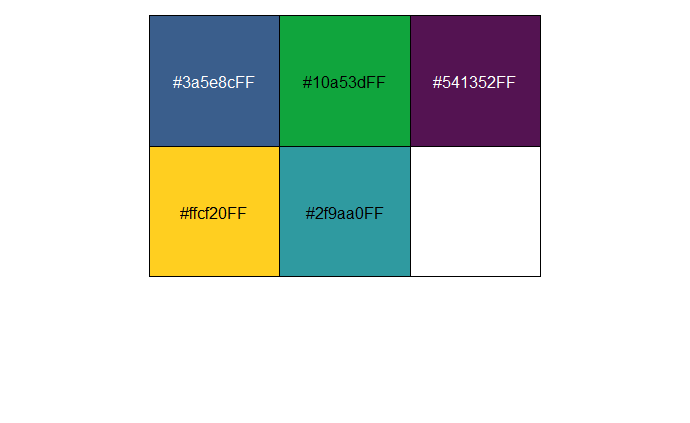
And, well, that is basically it. We then went on and had the textbook key colors be also based on Viridis. But that will be another post…
reference
The viridis color palette in R by Bob Rudis, Noam Ross and Simon Garnier Matplotlib colormaps, Option “D”.