World Management Survey and Gabors Data
We have collaborated with the fantastic team of the World Management Survey to create case studies and a dataset for learning some data analysis practices.

Daniella Scur, Rafaelle Sadun, Renata Lamos, John Van Reenen, and Gabor Bekes. Hope Nick Bloom might be seen if you concentrate enough:-)
Teaching metrics with WMS to business and management and econonomics students
One key experience in teaching econometrics or data analysis outside PhD programs is that students learn better when case studies are closer to their interest. Management is one such topic. It is a relevant topic for their future career, and the link between management and performance is a fascinating topic for many.
Pedagogical benefits
Let us flag three pedagogical benefits.
- Many students will work on survey later on. In a business, or government. Learning about survey design and execution is of great practical use, and a useful way to start understanding how datasets are born. WMS is a great example, it has many real-life features from formulating questions to scoring that could be useful.
- Descriptive statitics about the quality of management are interesting and not trivial. They can be discussed, debated, especially in a multi-national classroom.
- When thinking about the causal impact of management, there is a lot of room for discussion, drawing DAGS, debating if firm size is a confounder or a collider. Or what is the role of industry? Both these benfits allow using WMS in classes where interaction with students is valued. Both lend themselves to teaching almost like one would do with business case studies.
Some kind endorsements from John and Nick
Built on knowledge from WMS team
We used quite a few papers as references, and advised students to have a look:
- Bandiera, O., Lemos, R., Prat, A., & Sadun, R. (2018), “Managing the family firm: Evidence from CEOs at work,” Review of Financial Studies 31(5), 1605–1653.
- Bloom, N. & Van Reenen, J. V. (2007), “Measuring and explaining management practices across firms and countries,” Quarterly Journal of Economics 122(4), 1351–1408.
- Bloom, N., Eifert, B., Mahajan, A., McKenzie, D., & Roberts, J. (2012), “ Does management matter? Evidence from India,” Quarterly Journal of Economics 128(1), 1–51.
- Bloom, N., Lemos, R., Sadun, R., Scur, D., & Reenen, J. V. (2014), “The new empirical economics of management,” Journal of the European Economic Association 12, 835–876.
- Bloom, N., Sadun, R., & Reenen, J. V. (2017), “Why do we undervalue competent management?,” Harvard Business Review, September–October, 120–127.
- Lemos, R. & Scur, D. (2019), The ties that bind: implicit contracts and management practices in family-run firms, CEPR Discussion Papers 13794 (now)
Specialized dataset
The source of the data is the World Management Survey This public version is prepared for this textbook by the World Management Survey project team. Great thanks to Nick Bloom, John Van Reenen and Daniela Scur at WMS team.
Data: wms-survey-management.
Case studies
It is used in three case studies
1C Management quality and firm size: data collection
How different are firms and other organizations in the terms of their management practices? Is the quality of management related to how large the firms are? Is it affected by whether the owners are the company founders or their families? To answer these, and many related, questions, we need data on management quality. Such data was collected by the World Management Survey (WMS; https://worldmanagementsurvey.org/), an international research intitative to measure the differences in management practices across organizations and countries.
This case study illustrates how to collect data by surveys. It discusses sampling and its practical issues, and how to use a set of survey questions to measure and abstract concept such as the quality of management. This case study, similarly to the other case studies in this chapter, illustrates the choices and trade-offs data collection involves, practical issues that may arise during implementation, and how all that may affect data quality. There is no dataset to analyze in this case study.
4A Management quality and firm size: describing patterns of association
Are larger companies better managed? We want to explore the association between management quality and firm size in a particular country (Mexico). To answer this question we need to define the y and x variables in this comparison. In particular, we need to assess how the variables in the dataset correspond to the abstract concepts of management quality and firm size.
This case study uses the Mexican subsample of the World Management Survey dataset (wms-management-survey) from 2013. It illustrates how we can measure latent variables by proxy variables in the data and uncover patterns of association betewen those variables. It also illustrates the concepts of conditional probability, conditional distribution, and joint distribution. The case study introduces informative ways to visualize various aspects of patterns of association, such as the stacked bar chart, the scatterplot, the bin scatter, and comparing box plots and violin plots. We have introduced the data used here in case study 1C.
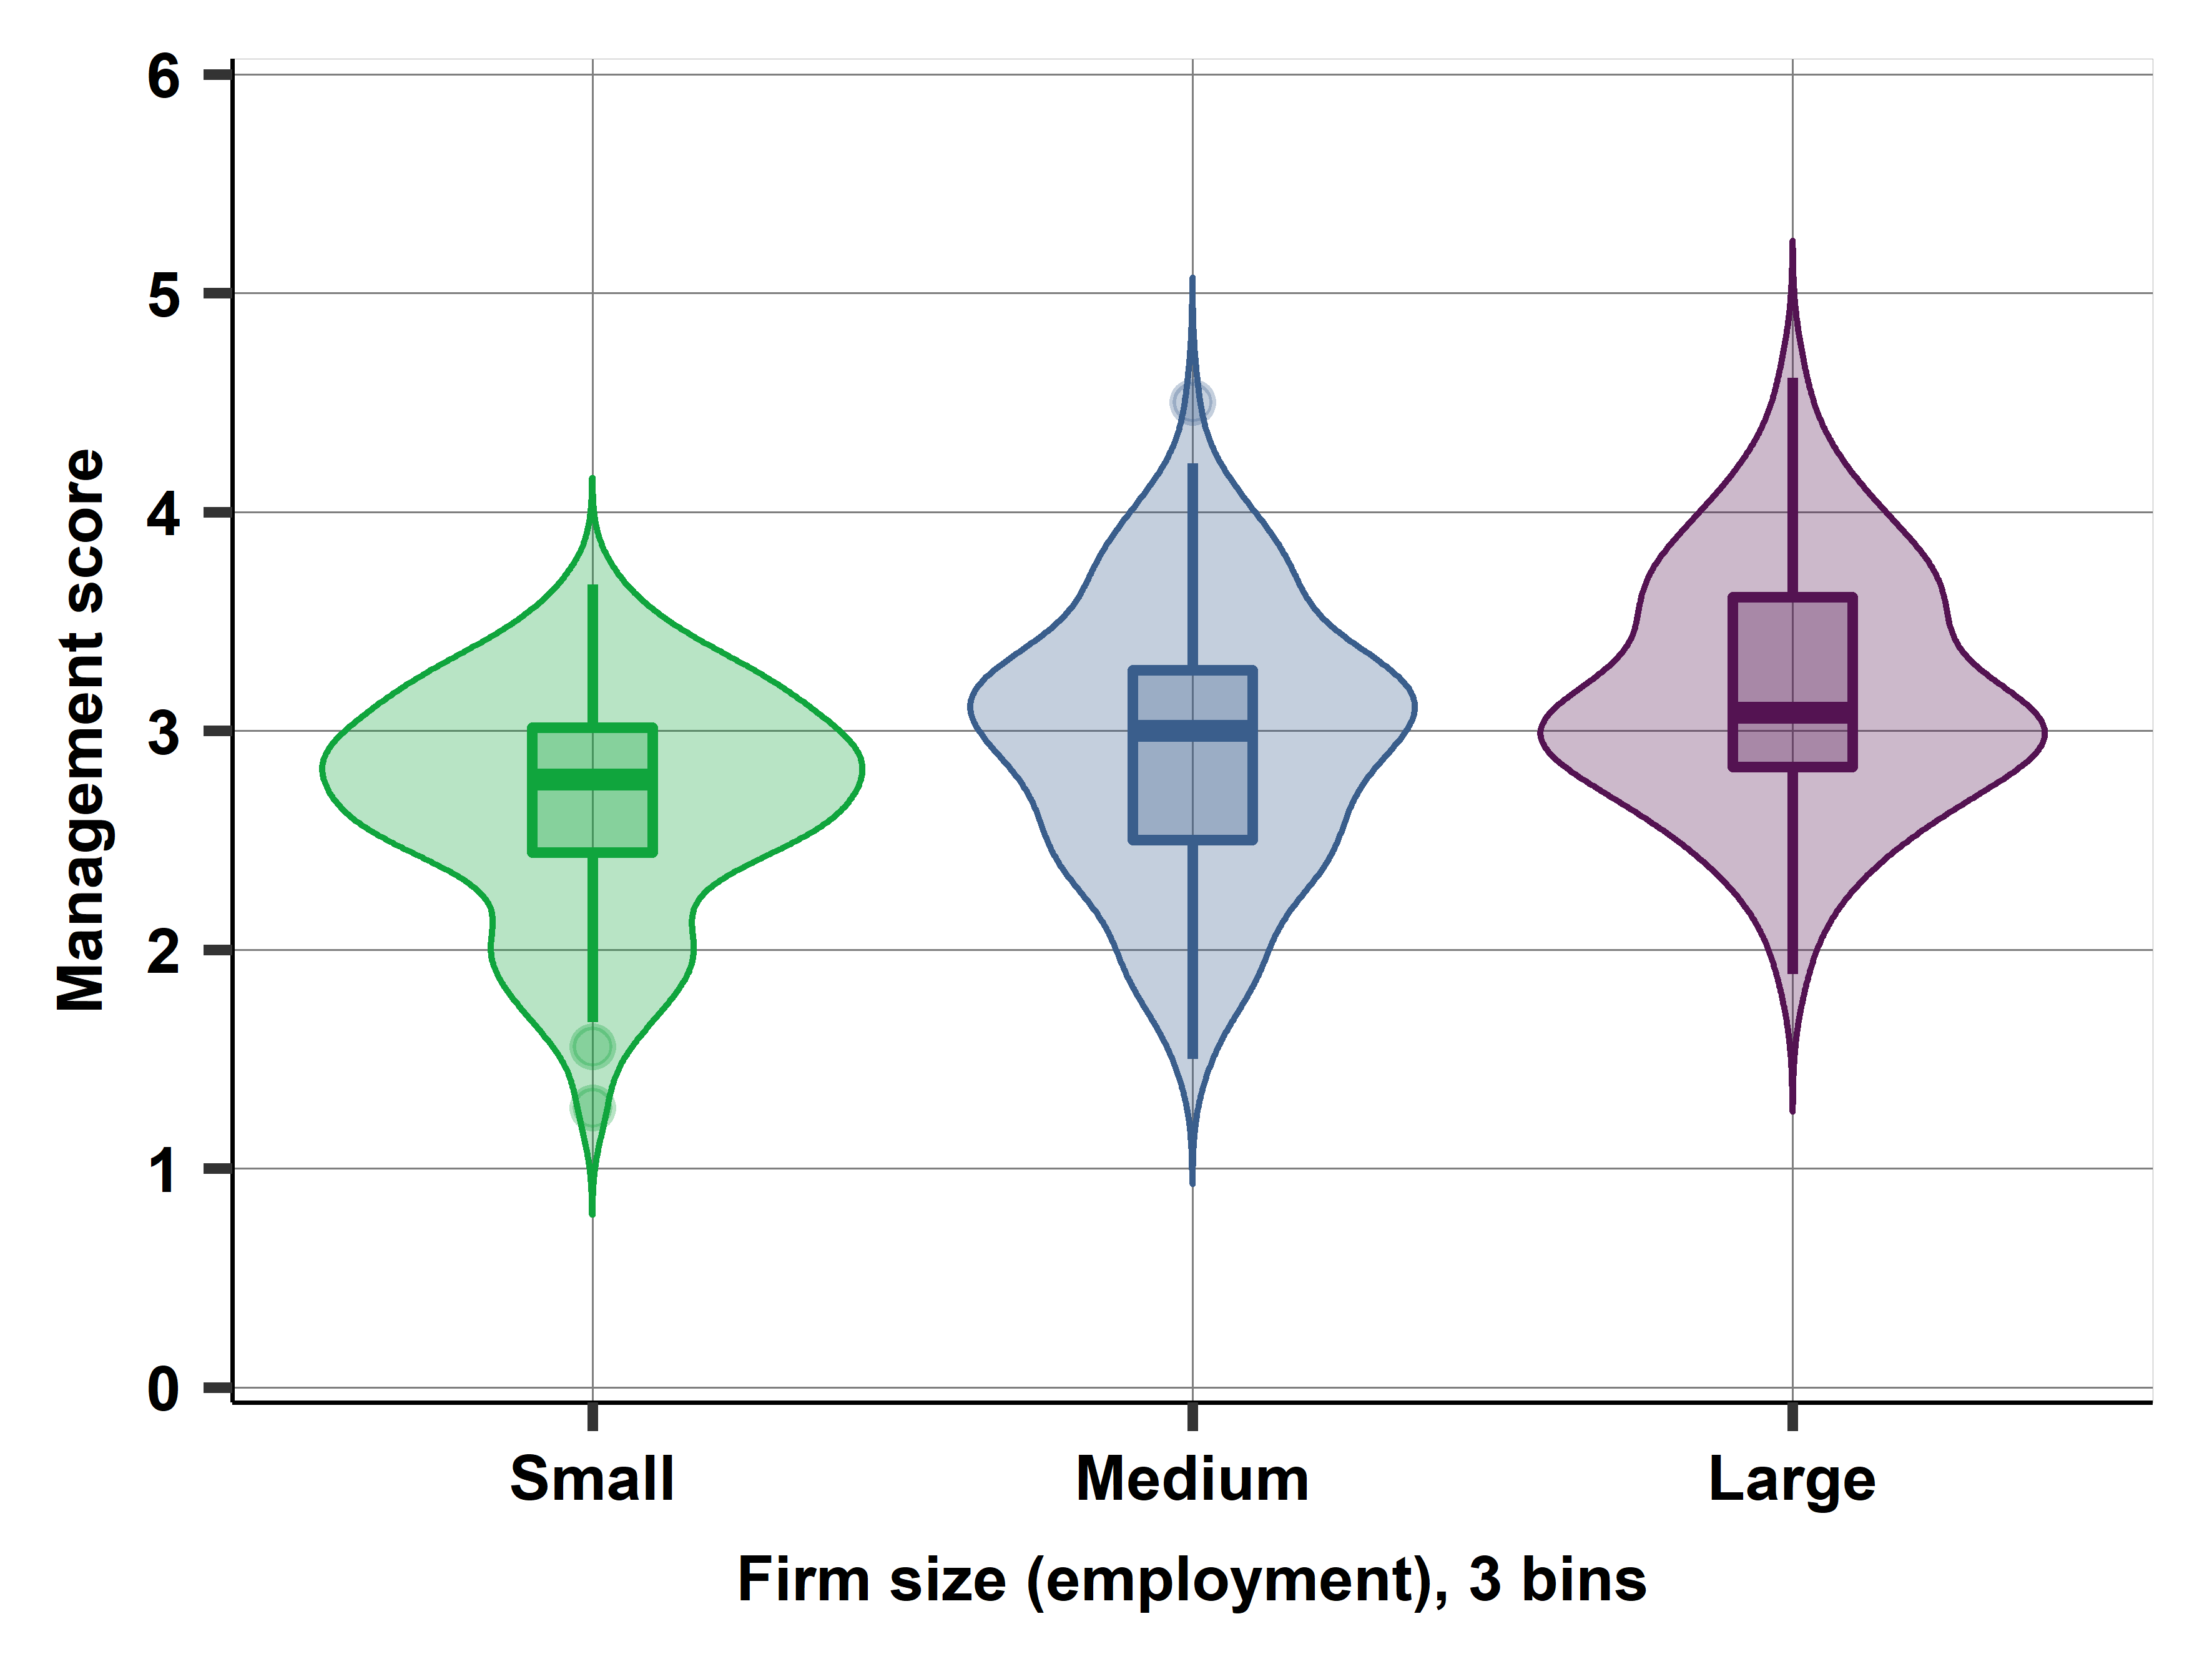
Mexico, firm size distribution, 3 bins + violin graph
Code: Stata or R or Python or ALL.
Data: wms-management-survey.
21A Founder/family ownership and quality of management
Many firms are owned by their founder or family members of their founder. Are such founder/family owned firms as well managed as other kinds of firms and, if there is a difference, how much of that that is due to their ownership as opposed to something else? Can we uncover that effect using cross-sectional observational data on firms and their management practices?
This case study uses the wms-survey-management dataset that we introduced in case study 1C. It is a large multi-country multi-sector survey of companies, measuring their management practices and other company characteristics. We use the cross-sectional sample collected from 24 countries between 2004 and 2015. The case study illustrates the use of thought experiments to clarify what effect we want to measure, how to think about what variables to condition on, and how we may sign the omitted variables bias. Besides multiple regression, it illustrates exact matching and matching on the propensity score, discussing their feasibility, advantages and disadvantages, and comparing their results. The case study is another example illustrating the difficulty to uncover an effect using cross-sectional observational data.
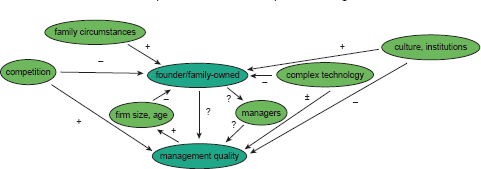
Causal map / DAG on case study
Code: Stata or R-prep, R-study or Python-prep, Python-study or ALL.
Data: wms-survey-management.
More about the data
The wms-management-survey data includes data on manufacturing companies from 24 countries and was collected between 2004 and 2015.
-
Raw data tables:
wms_da_textbookThis is dataset prepared for the textbook. It includes some firms multiple times. N= 14,277 -
Tidy data table:
wms_da_textbook-xsecAdjusted dataset, cross-sectional data that includes firms only once. N= 10,282
Important variables
| variable name | info | type |
|---|---|---|
| firmid | ID | numeric |
| cty | country code | string |
| management | management quality score | numeric |
| emp_firm | number of employees as per survey | numeric |
| degree_nm | % of employees (non-managers) with college degree | numeric |
| degree_m | % of managers with college degree | numeric |
| ownership | who owns the firm - ownership types | categorical |
Info on all variables: WMS Variables