Chapters Overview
Slideshows for all 24 chapters of Gabors Data Analysis!
Part 1: Data Exploration
Chapter 01: Origins of Data slides
Chapter 02: Preparing Data for Analysis slides
Chapter 03: Exploratory Data Analysis slides
Chapter 04: Comparison and Correlation slides
Chapter 05: Generalizing from Data slides
Chapter 06: Testing Hypotheses slides
Part II: Regression Analysis
Chapter 07: Simple Regression slides
Chapter 08: Complicated Patterns and Messy Data slides
Chapter 09: Generalizing Results of a Regression slides
Chapter 10: Multiple Linear Regression slides
Chapter 11: Modeling Probabilities slides
Chapter 12: Regression with Time Series Data slides
Part III: Prediction
Chapter 13: A Framework for Prediction slides
Chapter 14: Model Building for Prediction slides
Chapter 15: Regression Trees slides
Chapter 16: Random Forest and Boosting slides
Chapter 17: Probability Prediction and Classification slides
Chapter 18: Forecasting from Time Series Data slides
Part IV: Causal Analysis
Chapter 19: A Framework for Causal Analysis slides
Chapter 20: Designing and Analyzing Experiments slides
Chapter 21: Regression and Matching with Observational Data slides
Chapter 22: Difference-in-Differences slides
Chapter 23: Methods for Panel Data slides
Chapter 24: Appropriate Control Groups for Panel Data slides
Details on chapters
Part 1: Data Exploration
Chapter 01: Origins of Data
Chapter summary: This chapter is about data collection and data quality.
This chapter starts by introducing key concepts of data. It then describes the most important methods of data collection used in business, economics, and policy analysis, such as web scraping, using administrative sources, and conducting surveys. We introduce aspects of data quality, such as validity and reliability of variables and coverage of observations. We discuss how to assess and link data quality to how the data was collected. We devote a section to Big Data to understand what it is and how it may differ from more traditional data. This chapter also covers sampling, including random sampling and potential biases due to noncoverage and nonresponse, as well as ethical issues and some good practices in data collection.
Case Studies:
Finding a good deal among hotels
Comparing online and offline prices
Slides:
Chapter 01 Slideshow
Chapter 02: Preparing Data for Analysis
Chapter summary: This chapter is about preparing data for analysis: how to start working with data.
First, we clarify some concepts: types of variables, types of observations, data tables, and datasets. We then turn to the concept of tidy data: data tables with the same kinds of observations. We discuss potential issues with observations and variables, and how to deal with those issues. We describe good practices for the process of data cleaning and discuss the additional challenges of working with Big Data.
Case Studies:
CH02A Finding a good deal among hotels: data preparation
CH02B Finding a good deal among hotels: data preparation
Slides:
Chapter 02 Slideshow
Chapter 03: Exploratory Data Analysis
Chapter summary: This chapter is about exploratory data analysis.
The chapter starts with exploratory data analysis is important. It then discusses some basic concepts such as frequencies, probabilities, distributions, and extreme values. It includes guidelines for producing informative graphs and tables for presentation and describes the most important summary statistics. The chapter and its appendix also cover some of the most important theoretical distributions and their uses.
Case Studies:
Ch03A: Finding a good deal among hotels: data exploration
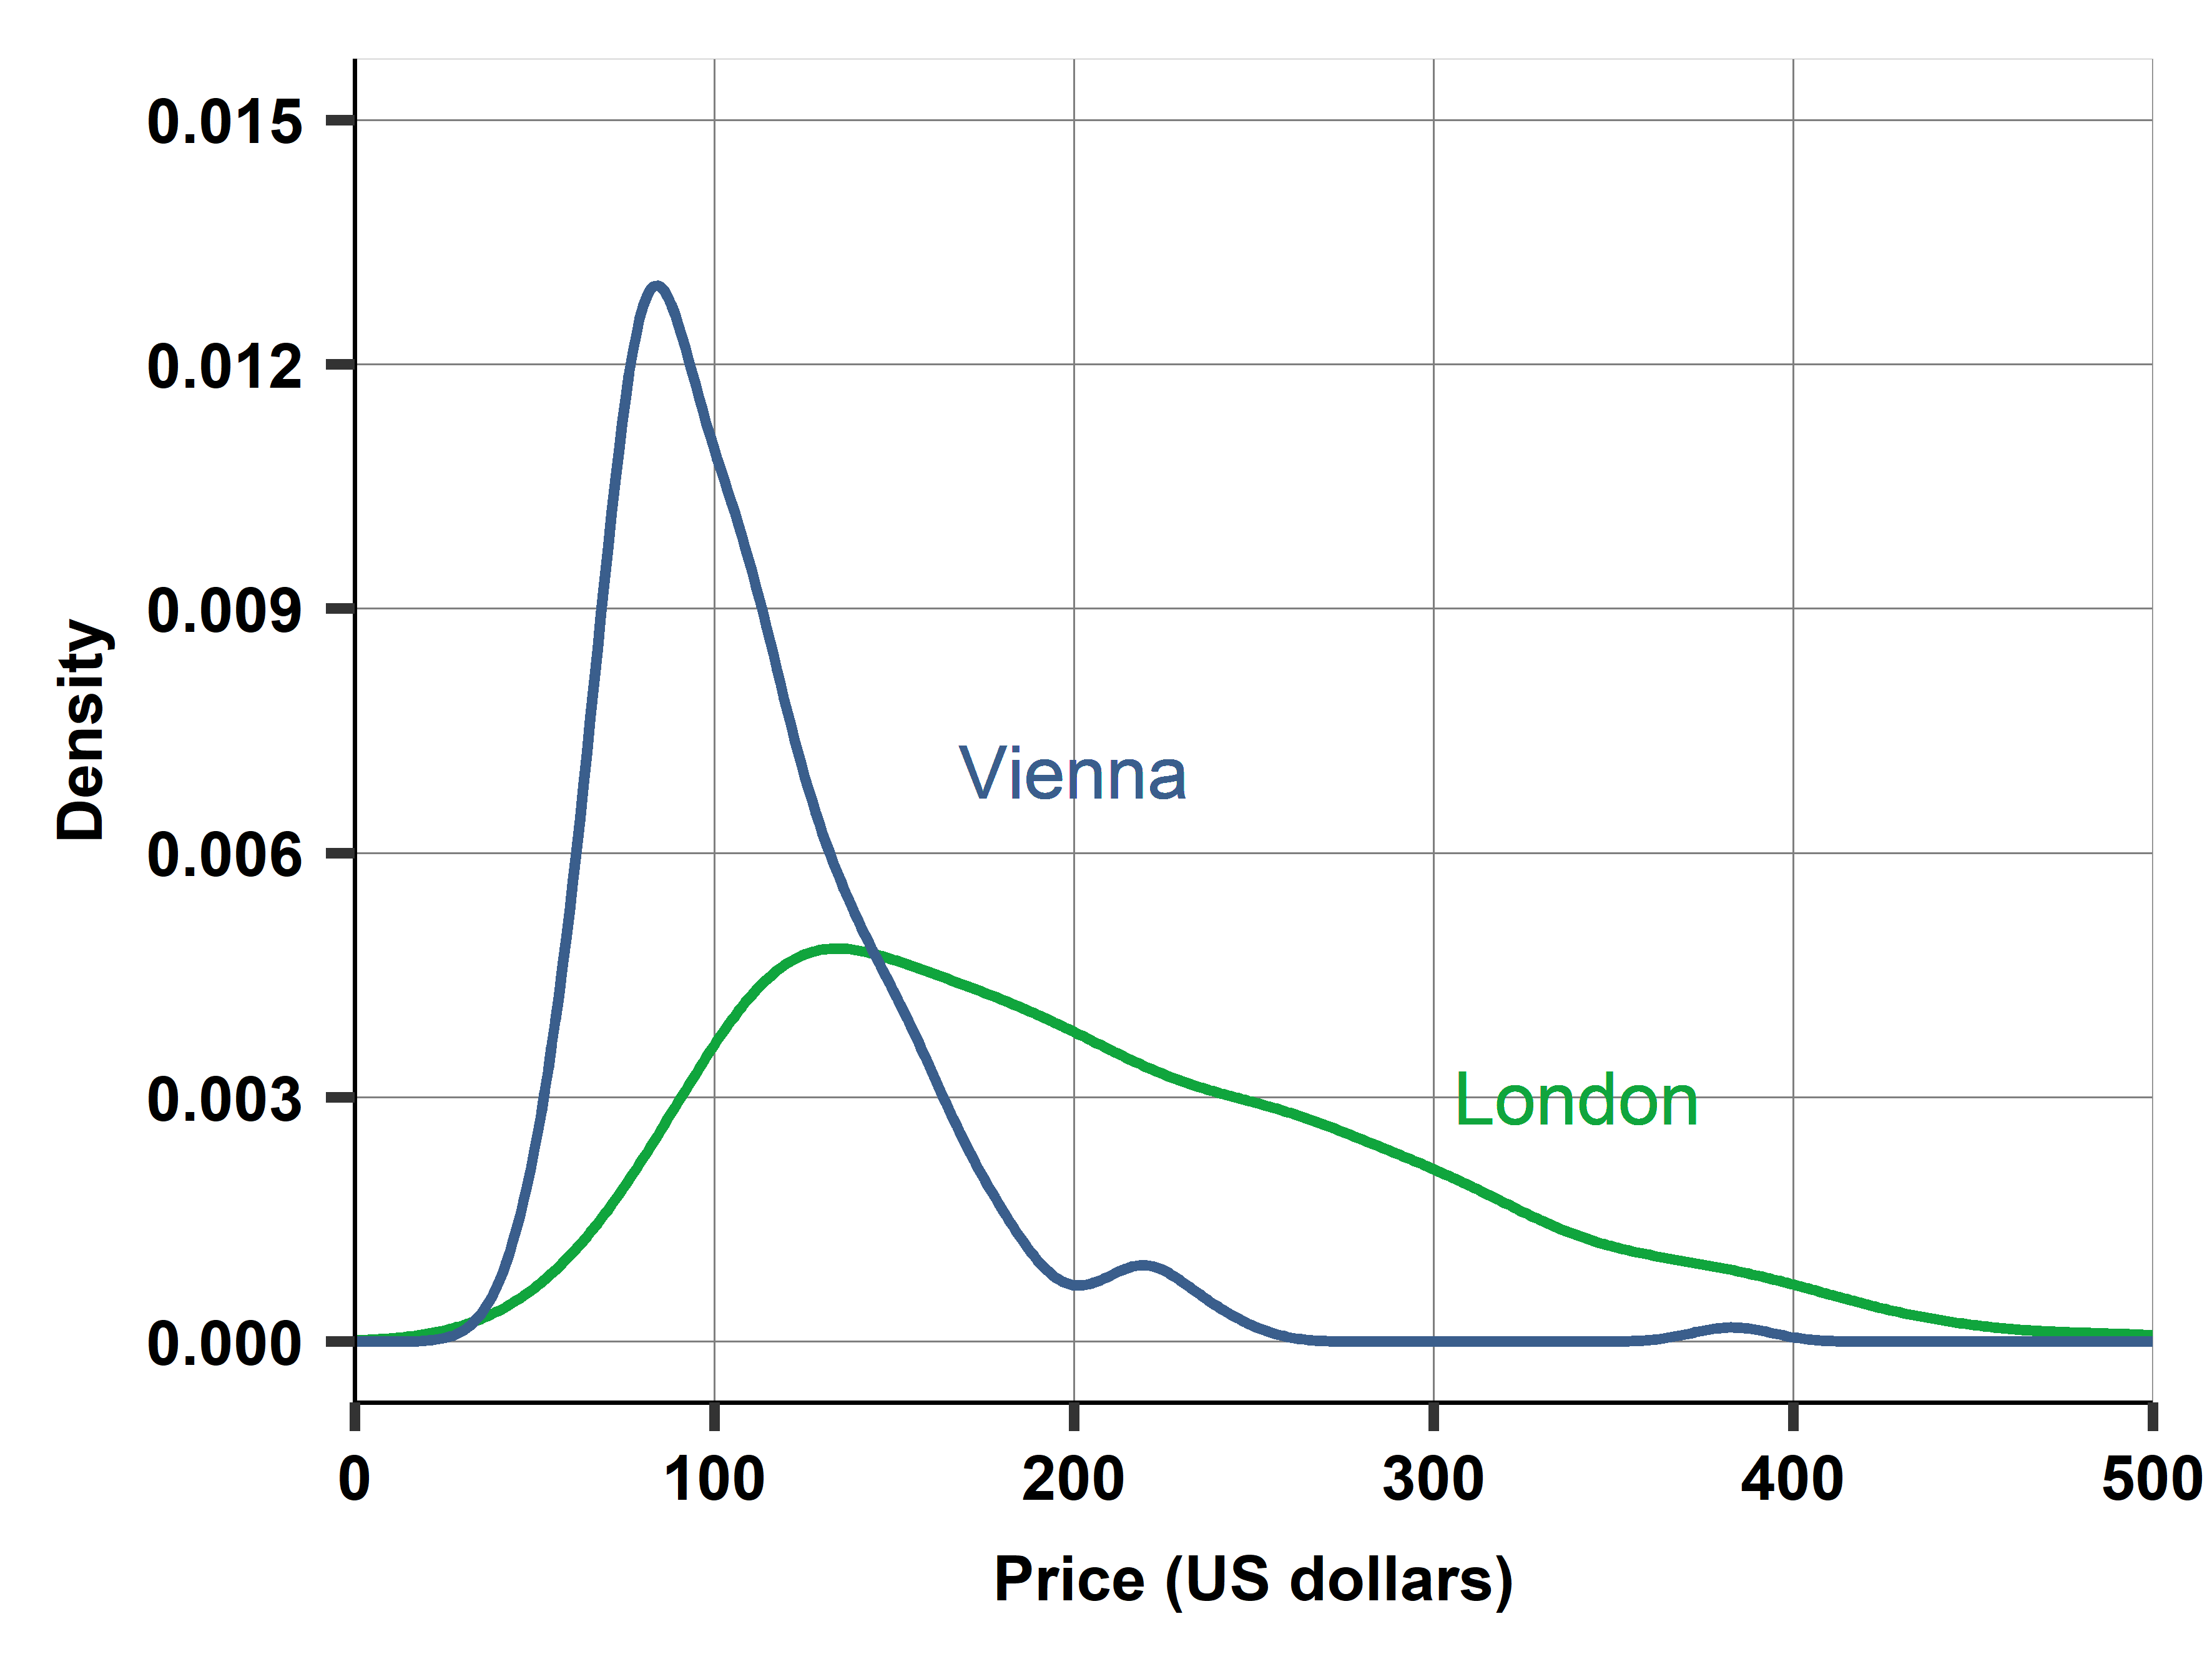
Ch03B: Comparing hotel prices in Europe: Vienna vs London
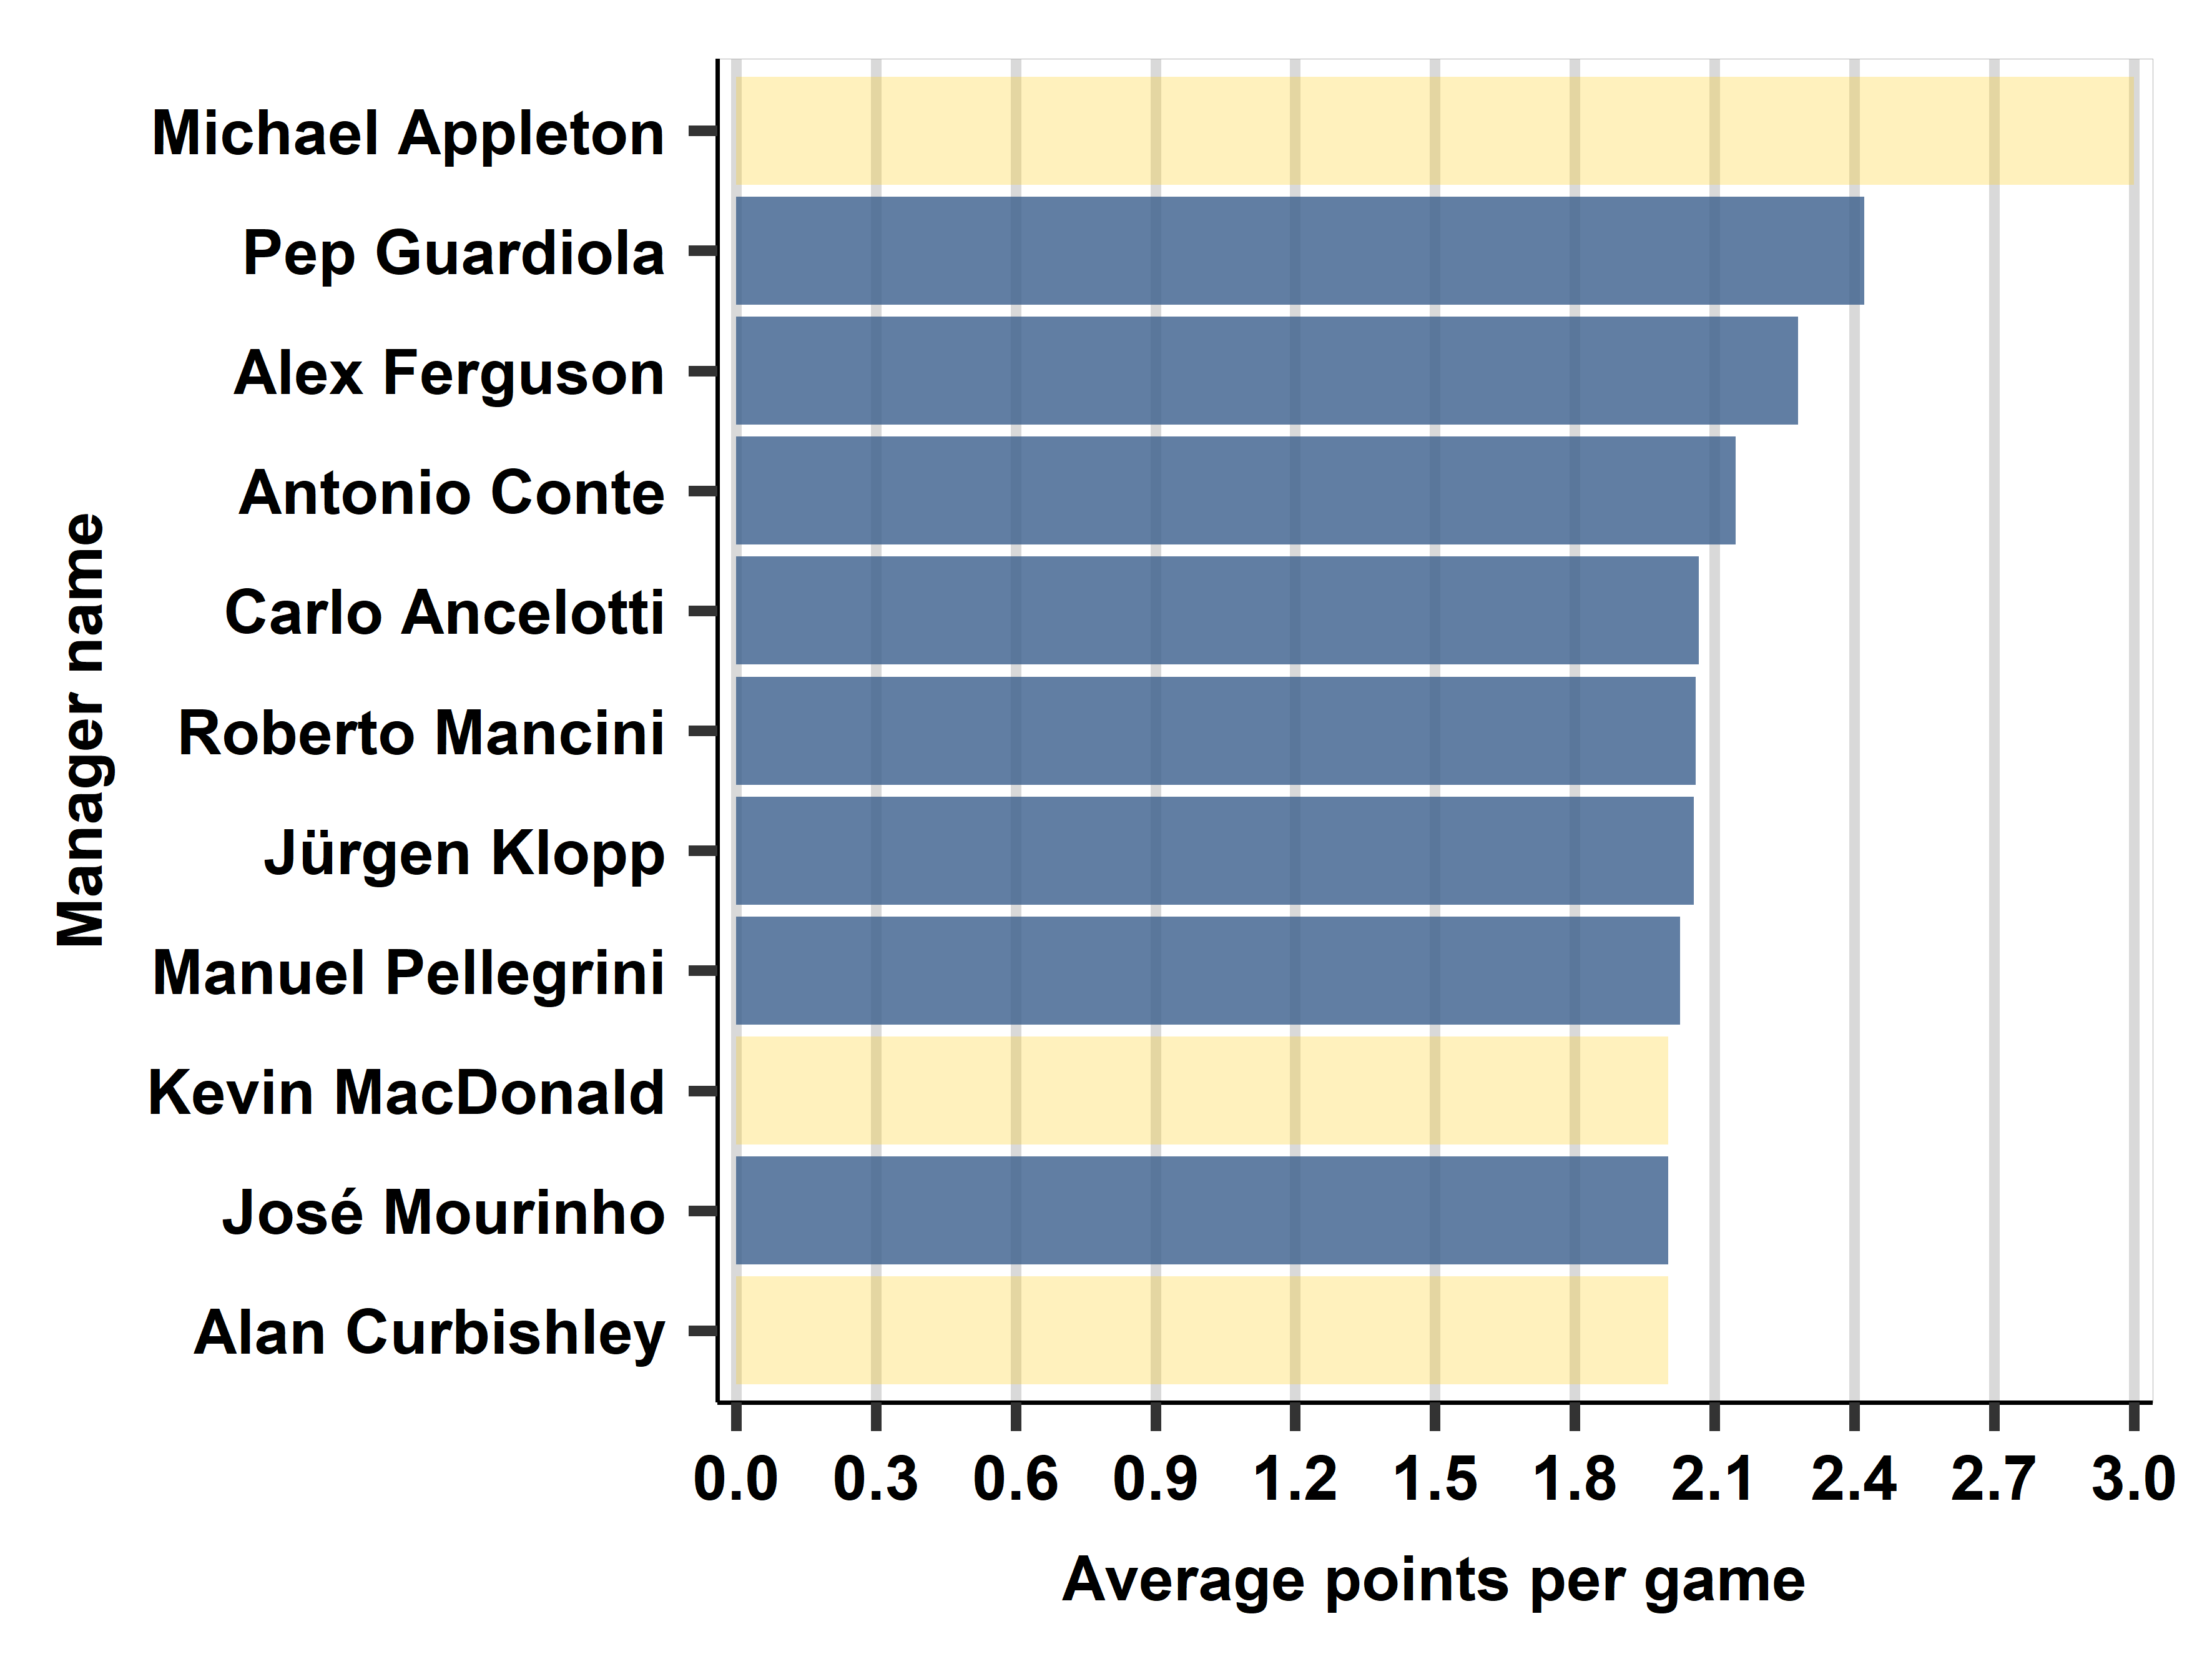
Ch03C: Measuring home team advantage in football
Ch03D: Distributions of body height and income
Ch03U1: Size distribution of Japanese cities
Slides:
Chapter 03 Slideshow
Chapter 04: Comparison and Correlation
Chapter summary: This chapter is about comparison, correlation, and conditioning.
Most methods of data analysis are based on comparing values of one variable, y, across observations with different values of another variable, x, or more such variables. This chapter instroduces simple methods of such comparison. We start by emphasizing that we need to define both y and x precisely for meaningful comparisons, and we need to measure them well. We introduce conditioning, and we discuss conditional comparisons, or further conditioning, which takes values of other variables into account as well. We discuss conditional probabilities, conditional distributions, and conditional means. We introduce the related concepts of dependence, mean-dependence, and we introduce covariance and correlation. Throughout the chapter, we discuss informative visualization of the various kinds of comparisons.
Case Studies:
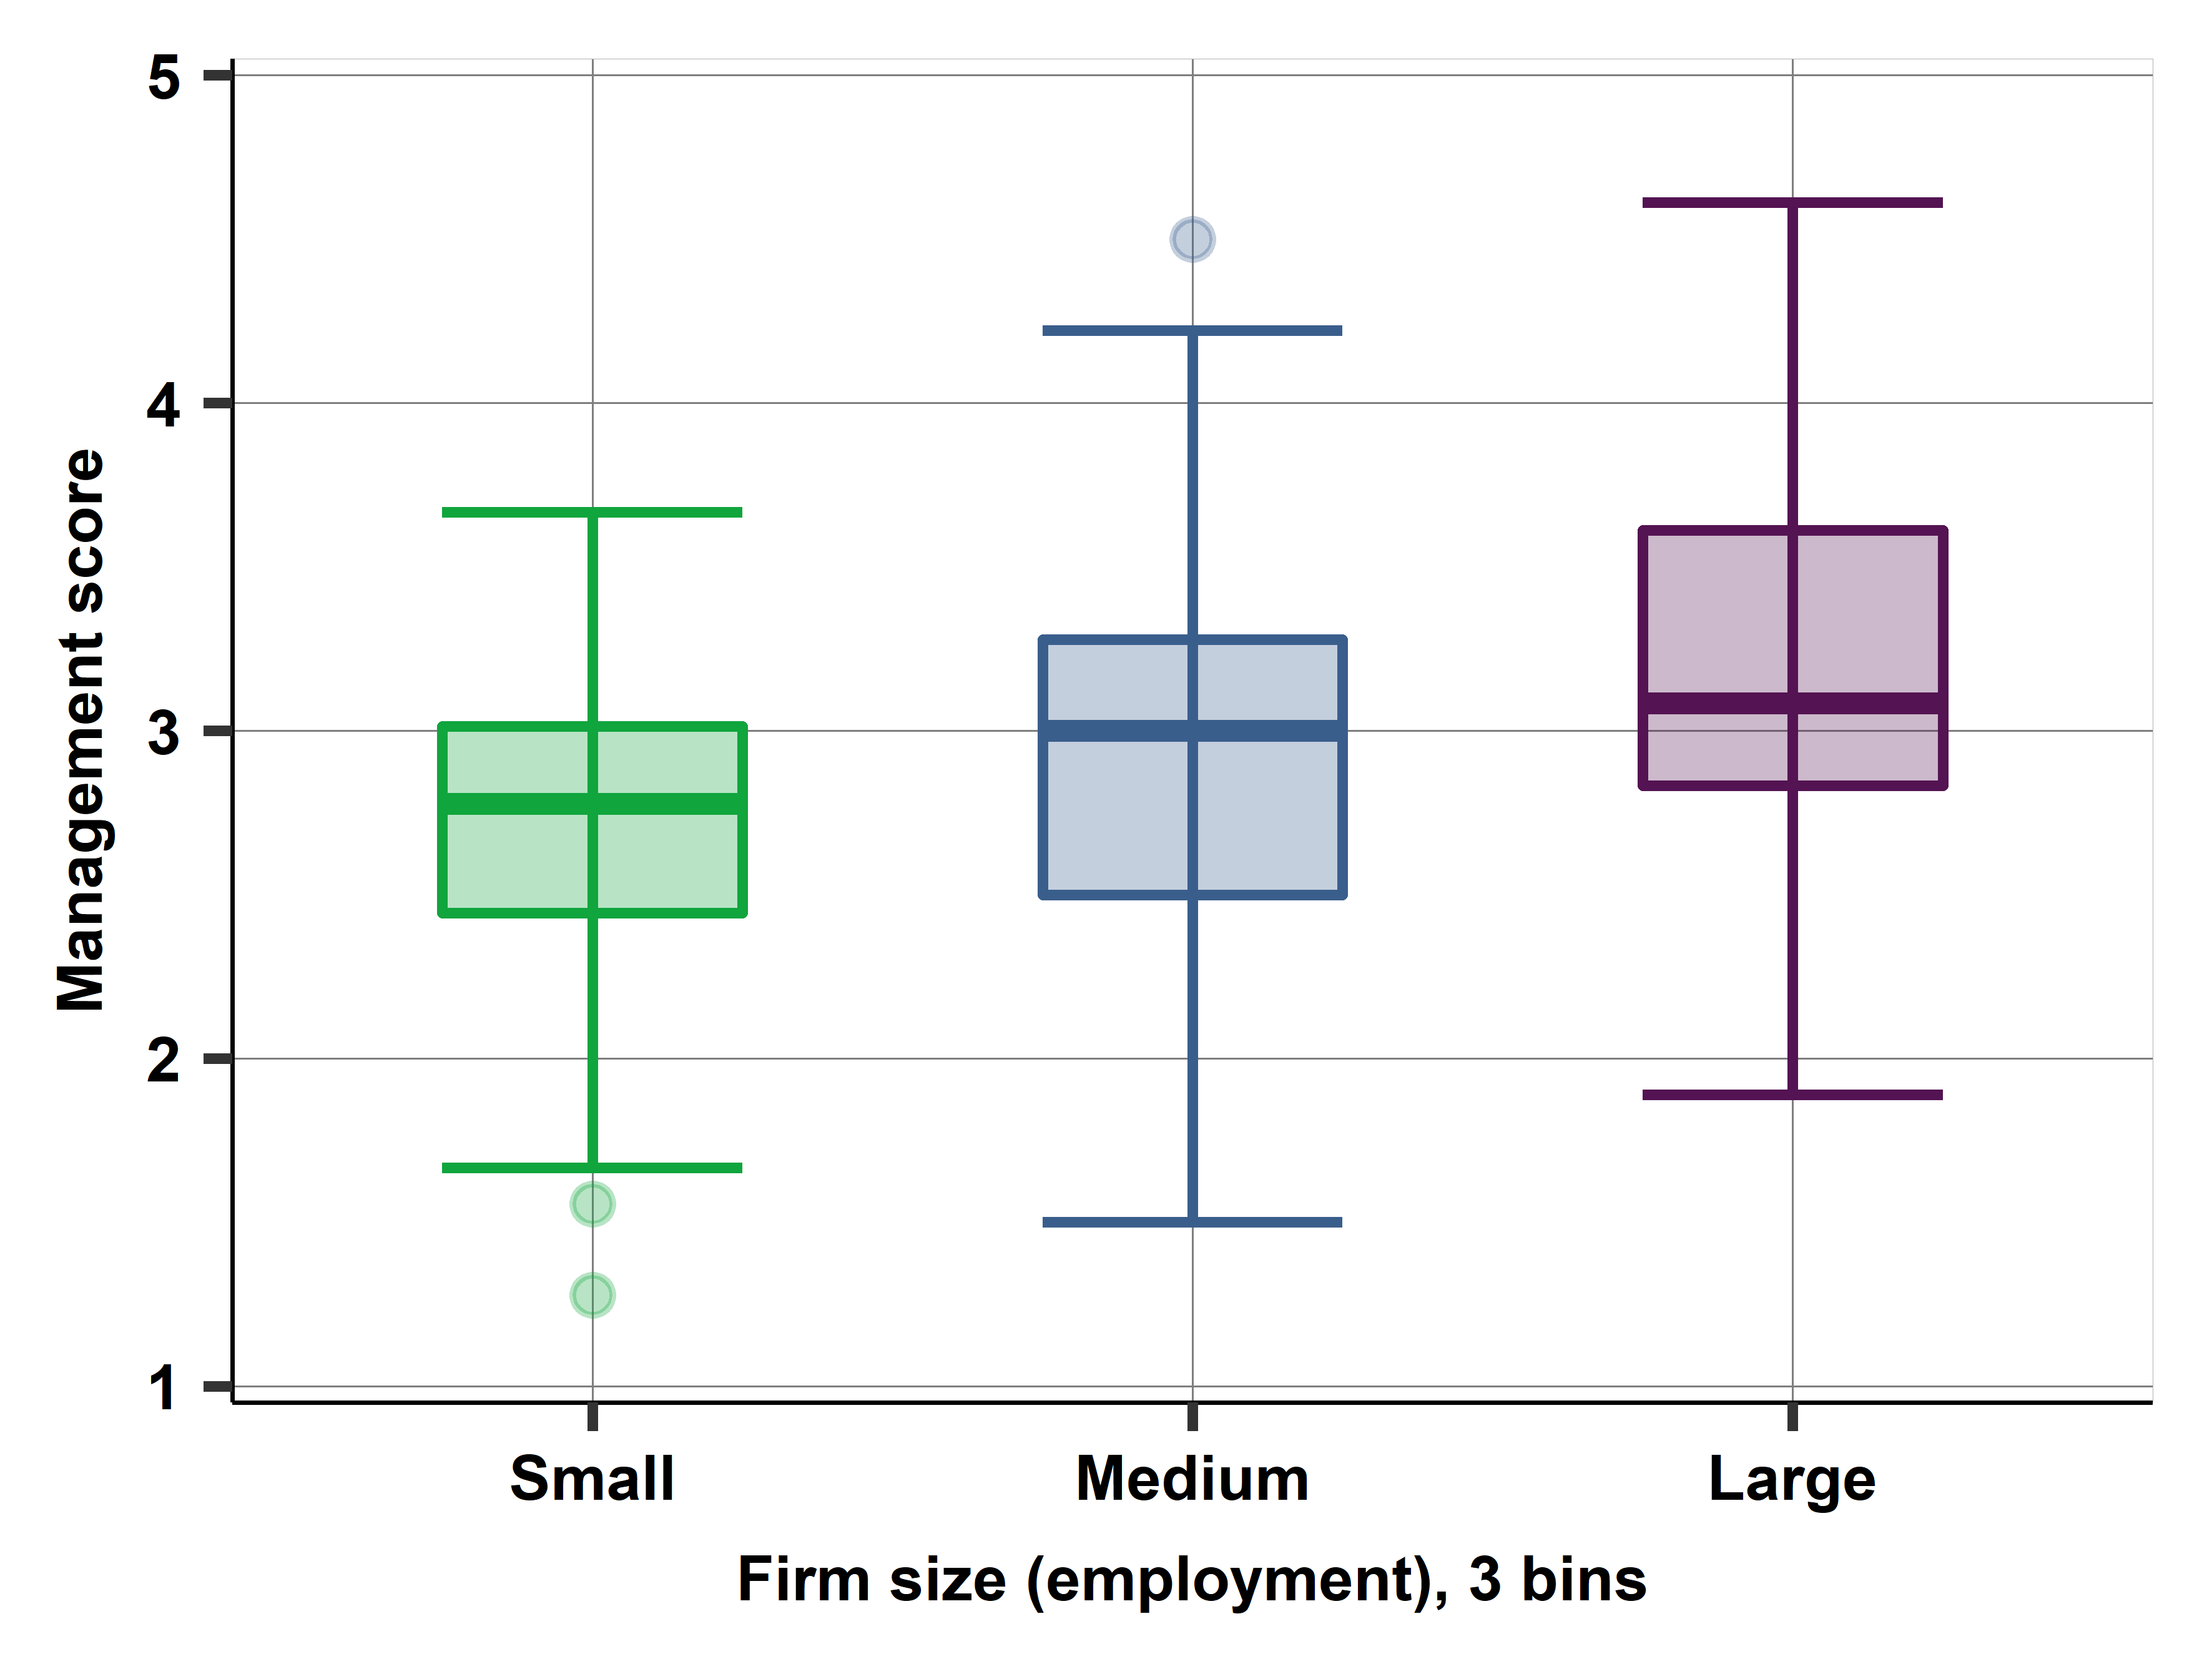
Ch04A: Management quality and firm size: describing patterns of association
Slides:
Chapter 04 Slideshow
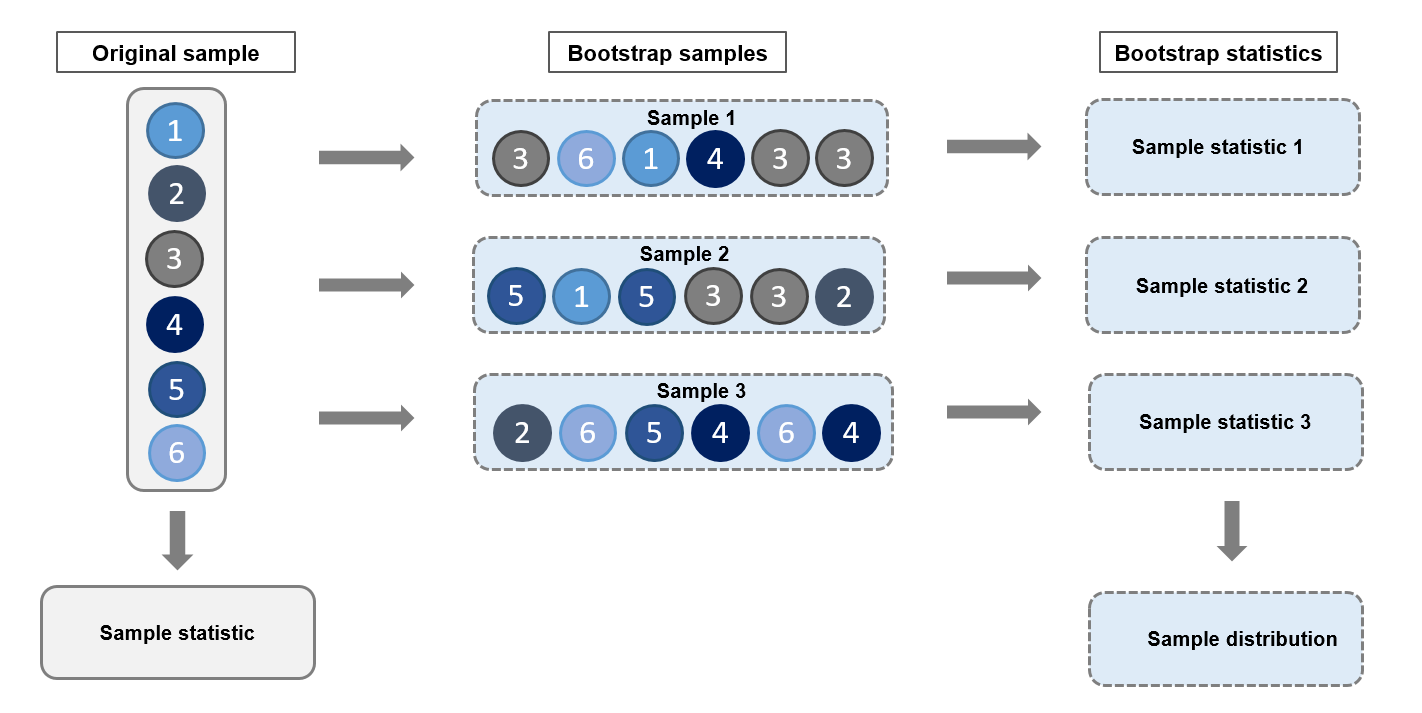
Chapter 05: Generalizing from Data
Chapter summary: This chapter is about generalizing from data: sampling, inference, external validity.
This chapter introduces the conceptual issues with generalizing results from our data to the general pattern we care about and methods of statistical inference. We start by discussing the two steps of the process of generalization: generalizing from the data to the general pattern our data represents, such as a population, and assessing how the general pattern that is relevant for the situation we care about relates to the general pattern our data represents. The first task is statistical inference, the second is assessing external validity. We introduce the conceptual framework of repeated samples and estimation. We introduce the standard error and the confidence interval that quantify the uncertainty of this step of generalization. We introduce two methods to estimate the standard error, the bootstrap and the standard error formula. Discussing external validity, we acknowledge that there are no readily available methods to quantify the uncertainty of this step of generalization, but we discuss how we can think about it and how we may use the results of additional data analysis to assess it.
Case Studies:
Ch05A: What likelihood of loss to expect on a stock portfolio?
Slides:
Chapter 05 Slideshow
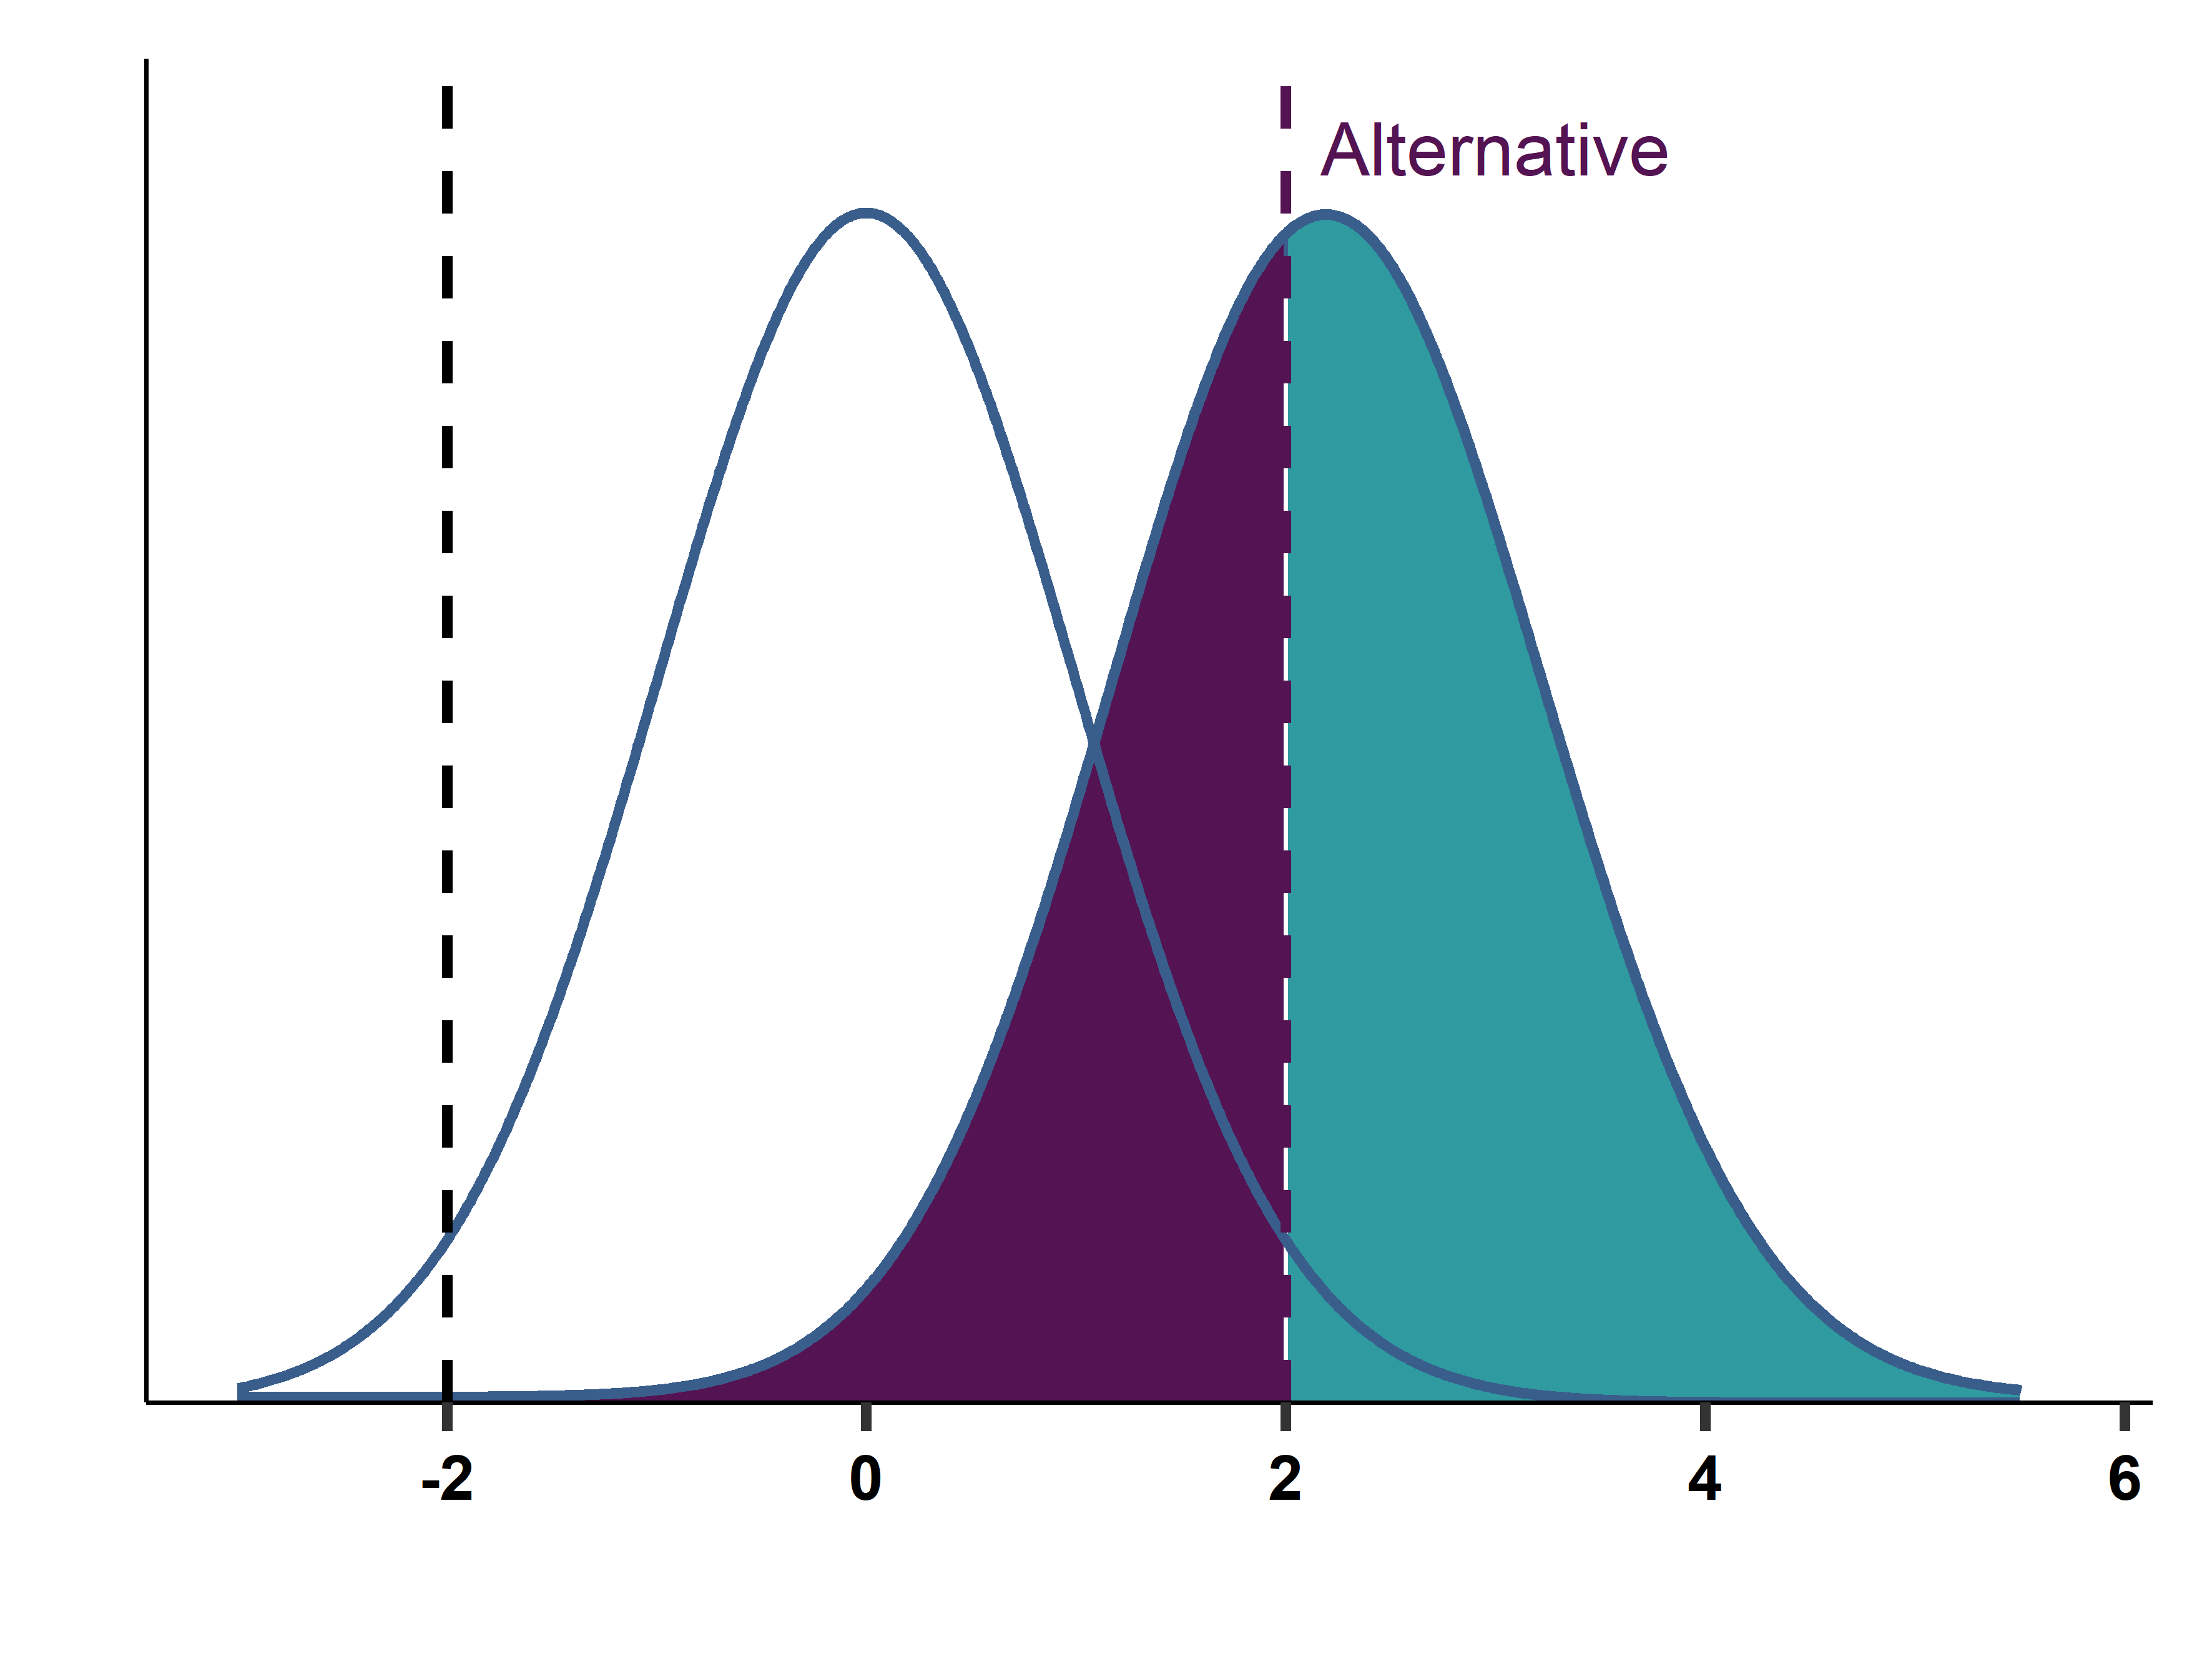
Chapter 06: Testing Hypotheses
Chapter summary: This chapter is about testing hypotheses.
This chapter introduces the logic and practice of testing hypotheses. We describe the steps of hypothesis testing and discuss two alternative ways to carry it out: one with the help of a test statistic and a critical value, and another one with the help of a p-value. We discuss how decision rules are derived from our desire to control the likelihood of making erroneous decisions (false positives and false negatives), and how significance levels, power, and p-values are related to the likelihood of those errors. We focus on testing hypotheses about averages, but, as we show in one of our case studies, this focus is less restrictive than it may appear. The chapter covers one-sided versus two-sided alternatives, issues with testing multiple hypotheses, the perils of p-hacking, and some issues with testing on Big Data.
Case Studies:
Ch06A: Comparing online and offline prices: testing the difference
Ch06B: Testing the likelihood of loss on a stock portfolio
Slides:
Chapter 06 Slideshow
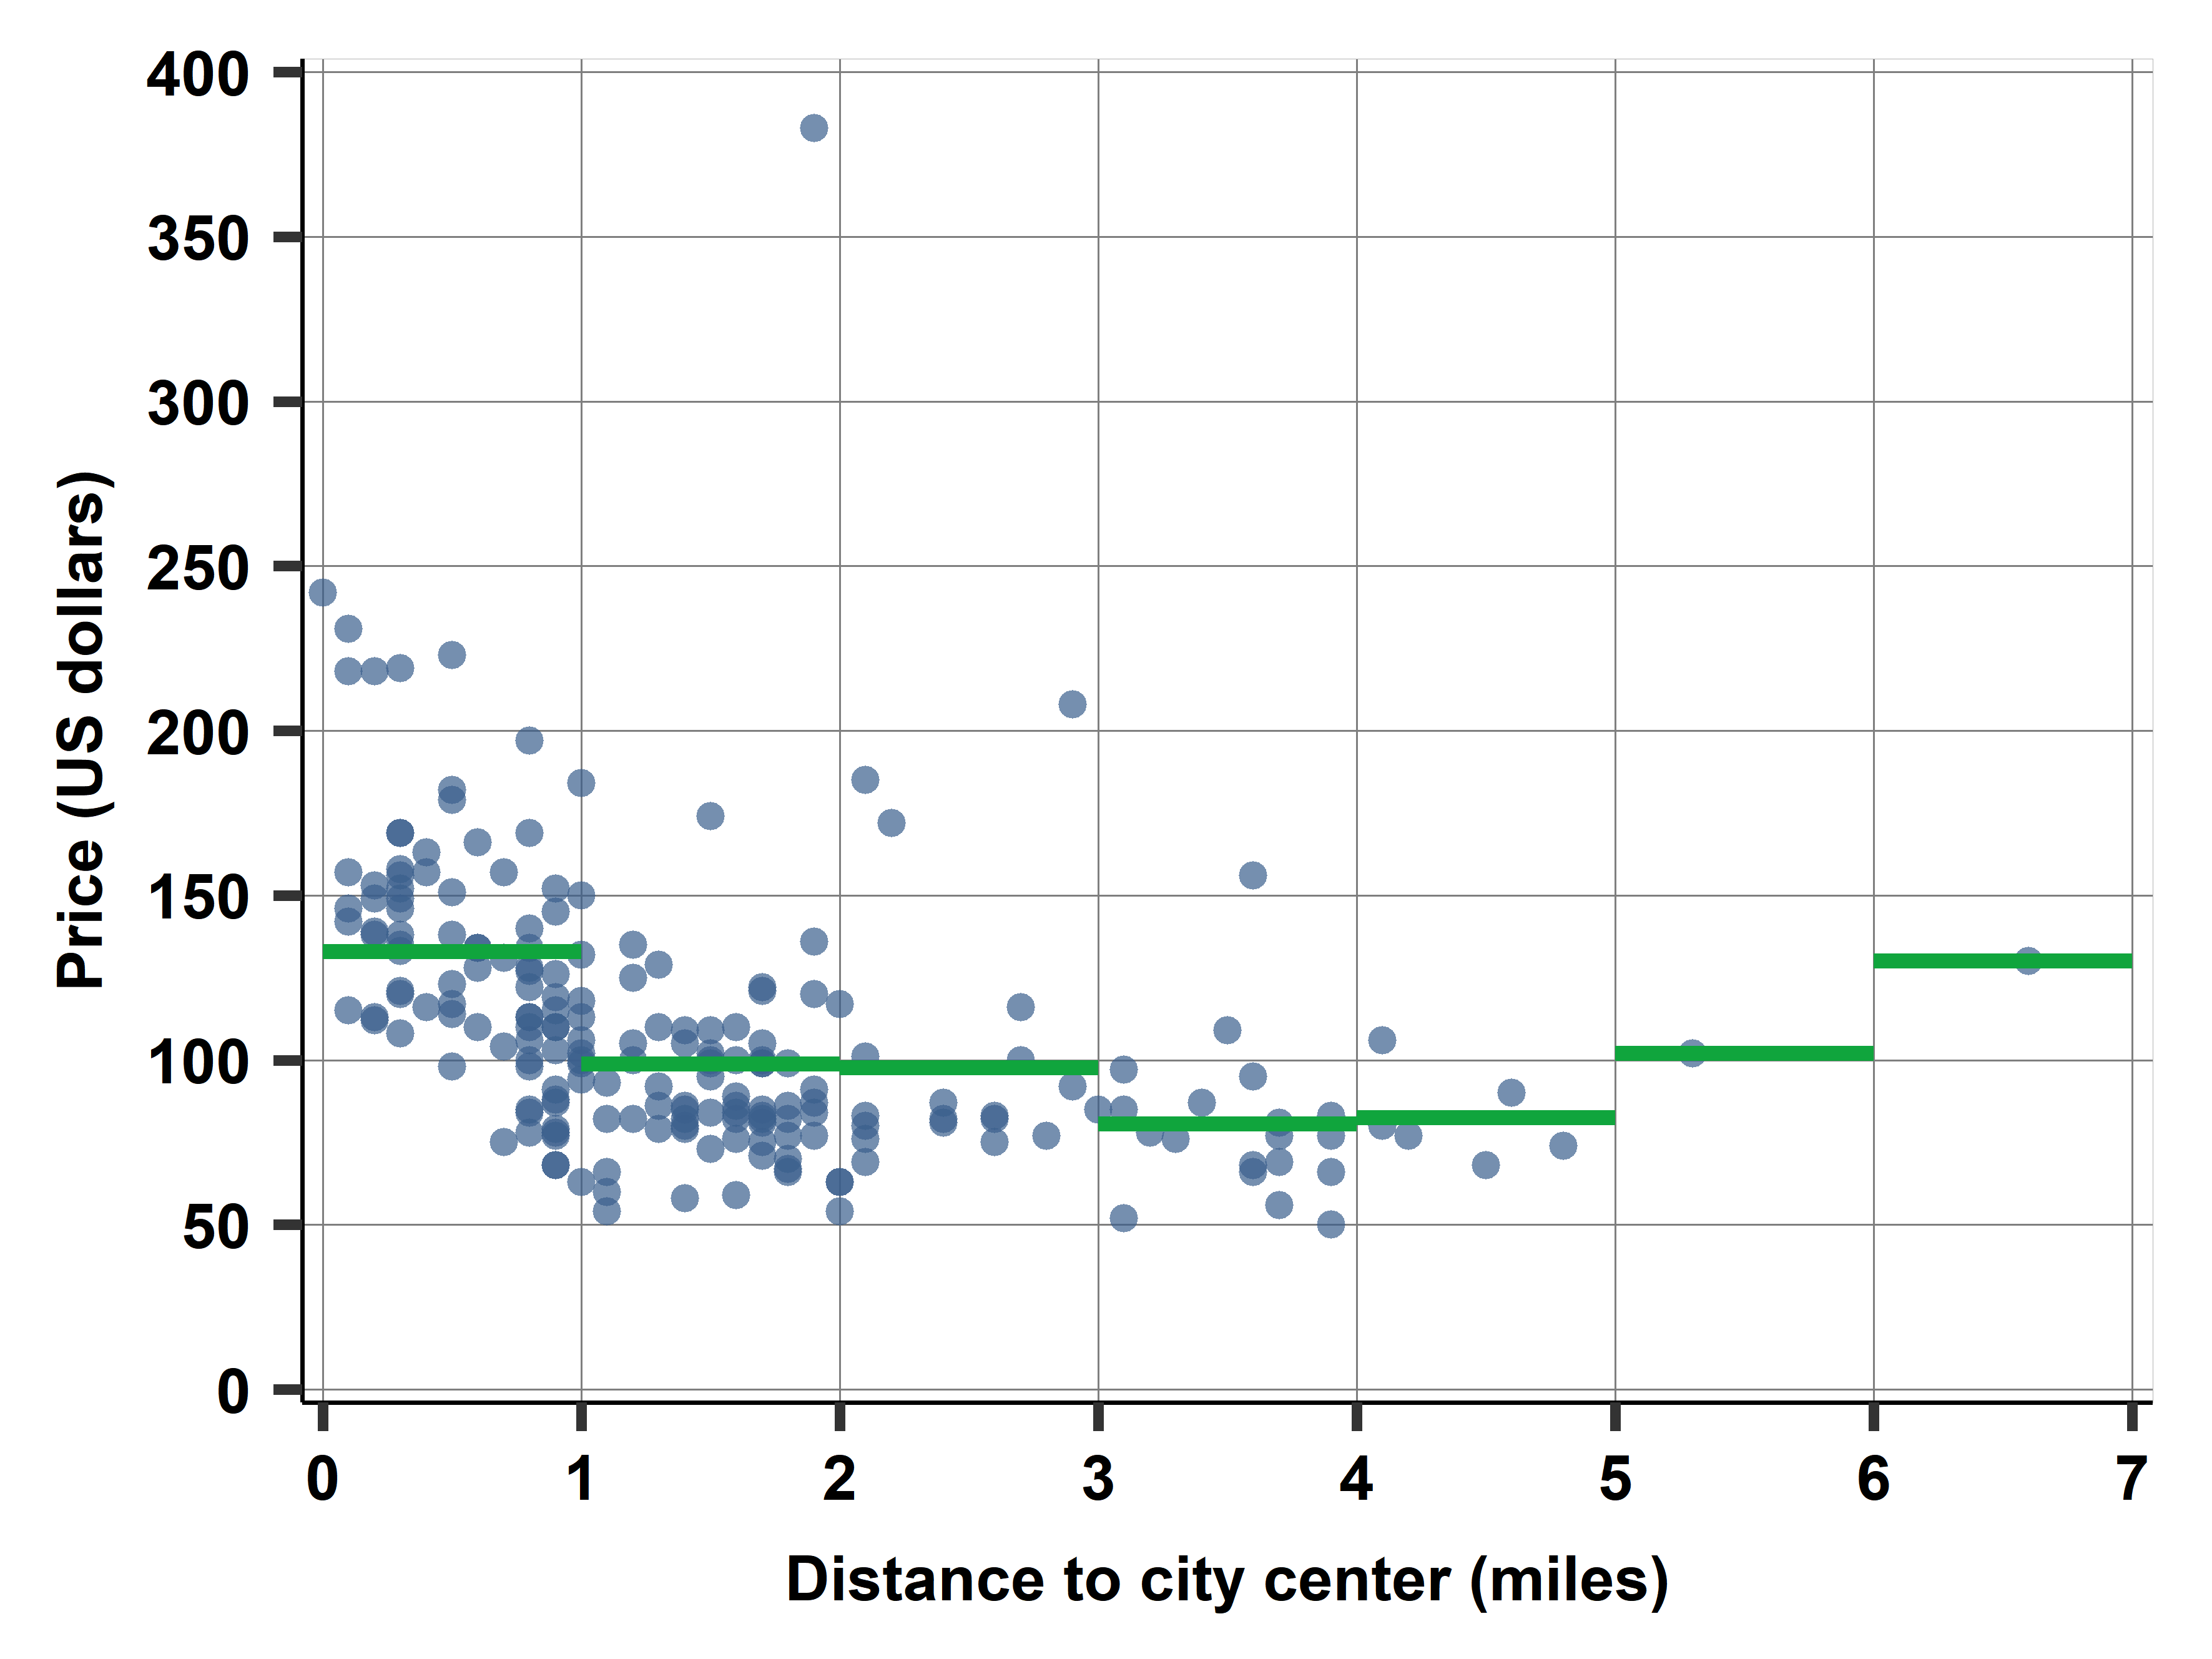
Chapter 07: Simple Regression
Chapter summary: This chapter is about simple regression.
In this chapter, we introduce simple non-parametric regression and simple linear regression. We discuss nonparametric regressions such as bin scatters, step functions and lowess regressions and their visualization. The larger part of the chapter discusses simple linear regression in detail. We introduce the regression equation, how its coefficients are estimated in actual data by the method of ordinary least squares (OLS), and we emphasize how to interpret the coefficients. We introduce the concepts of predicted value, residual, and goodness of fit, and we discuss the relationship between regression and correlation. We end with a note on the relationship between causation and regression.
Case Studies:
Ch07A: Finding a good deal among hotels with simple regression
Slides:
Chapter 07 Slideshow
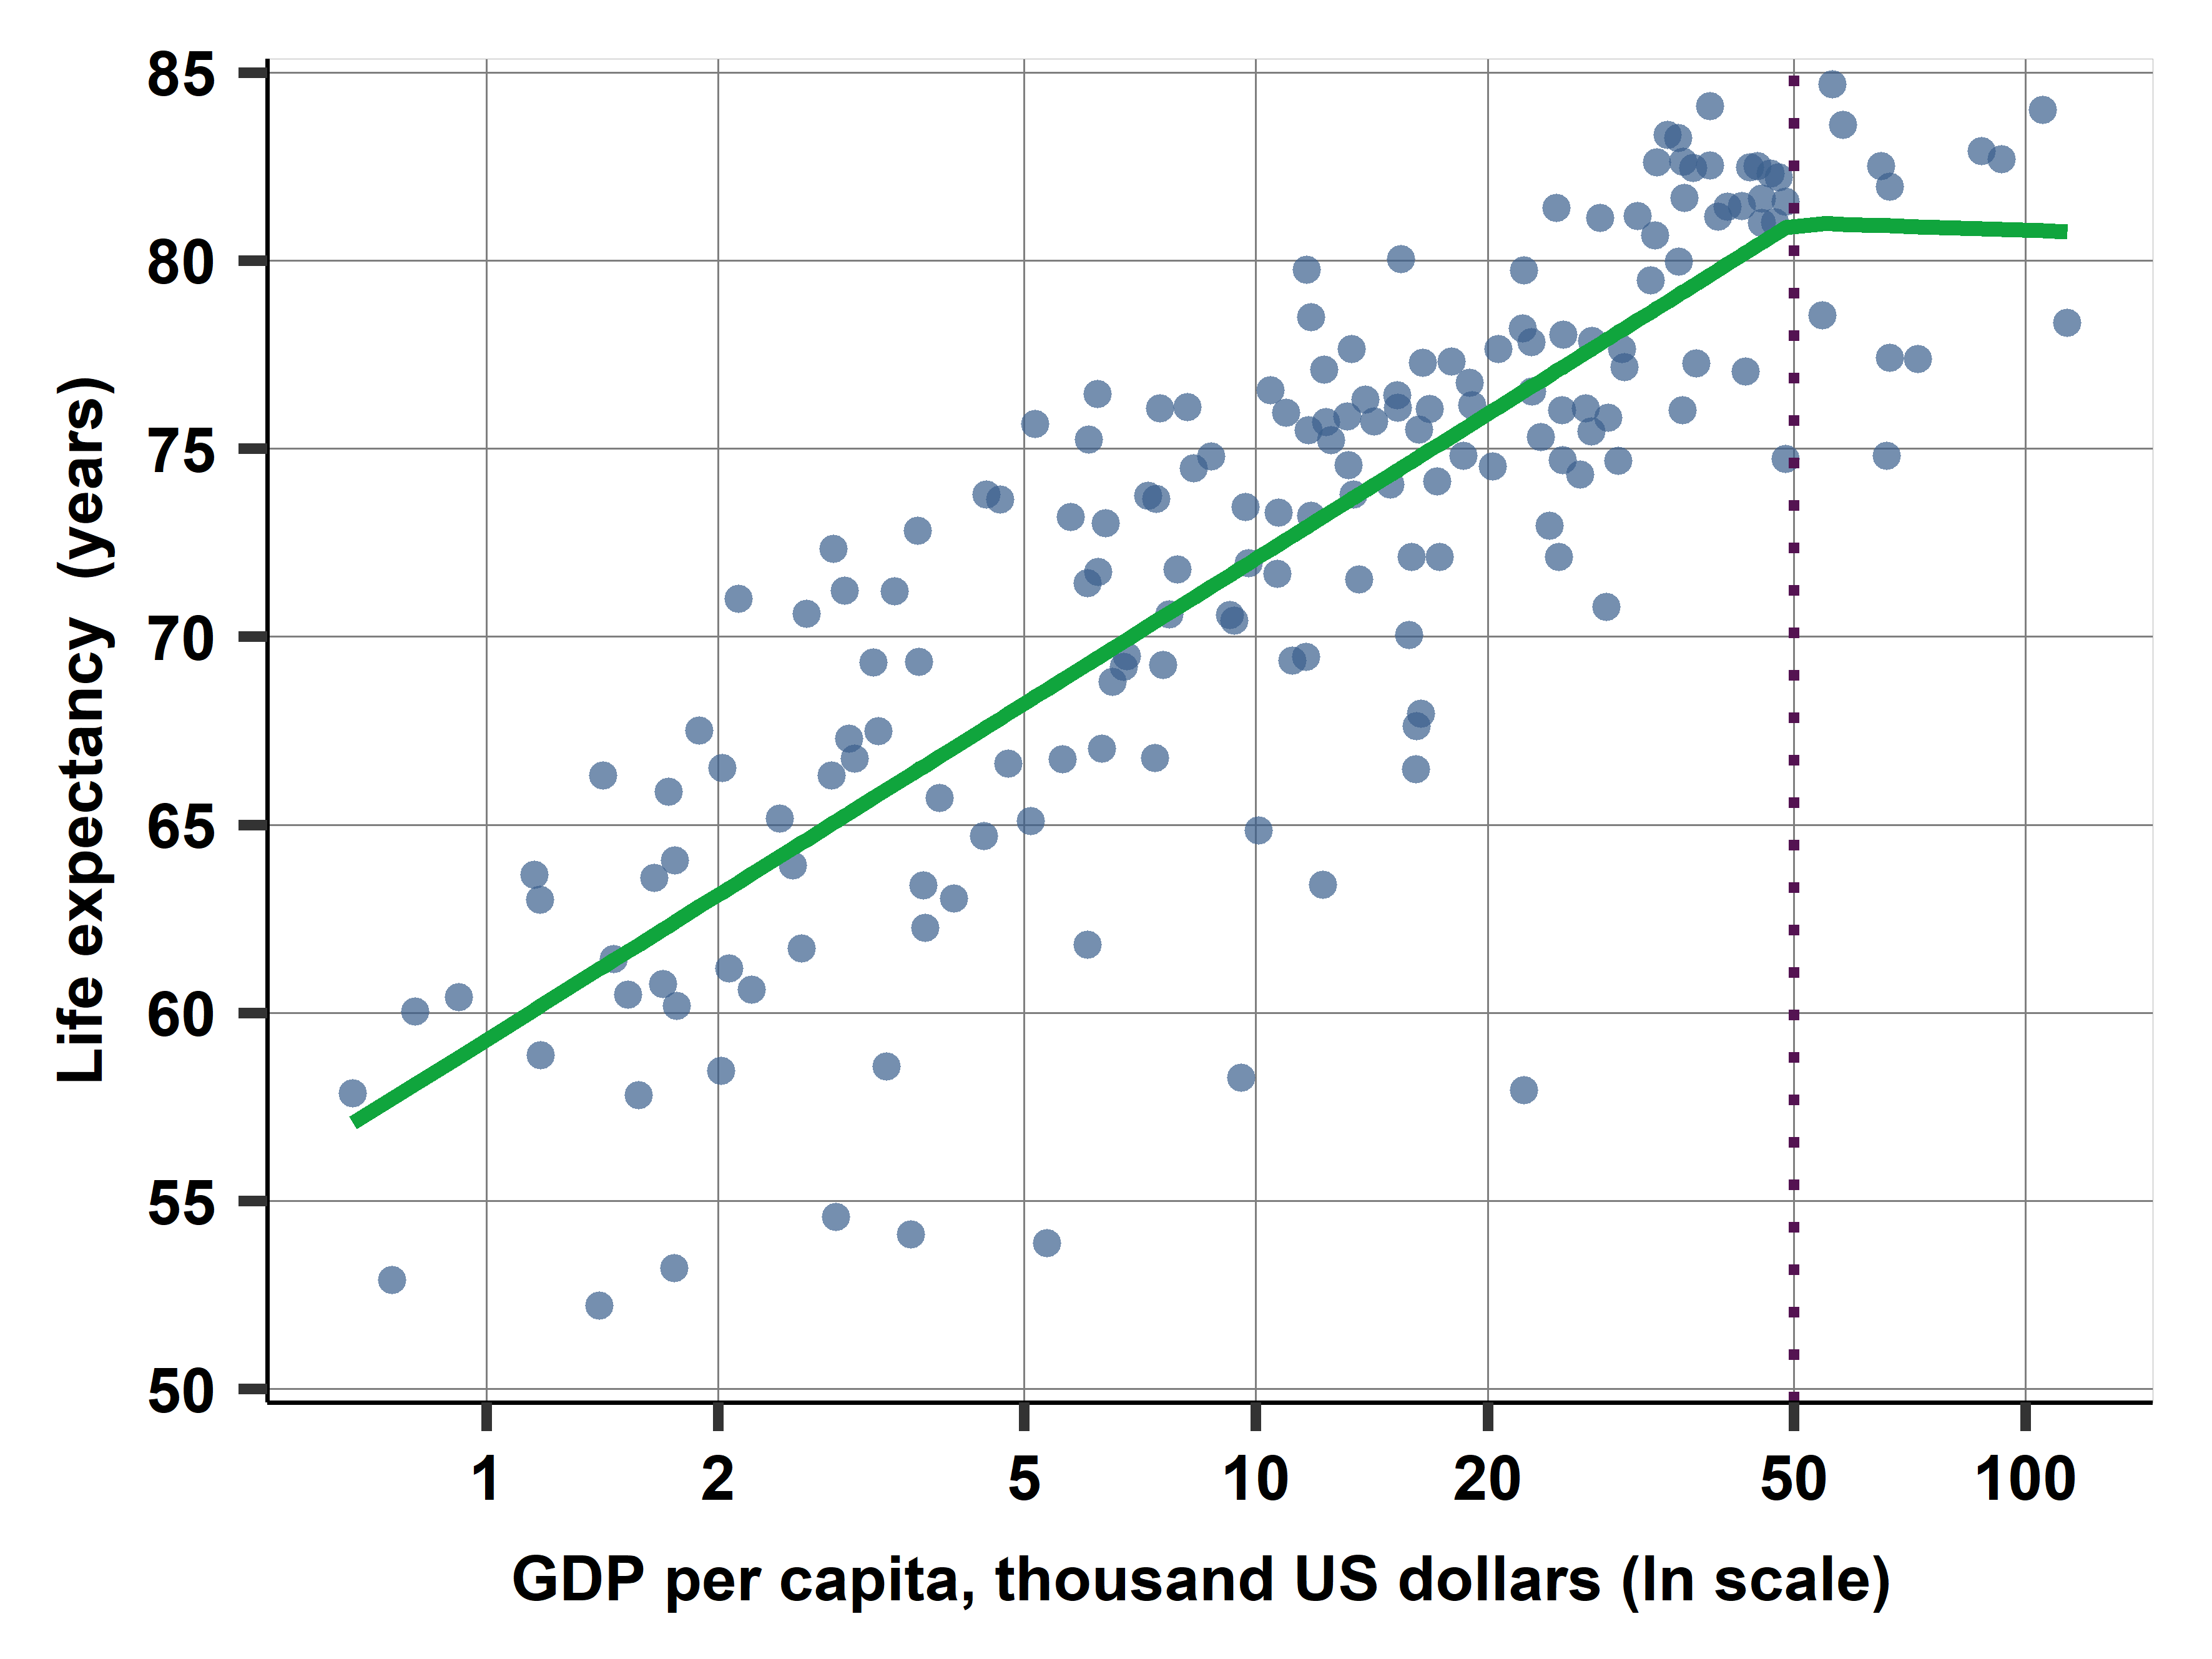
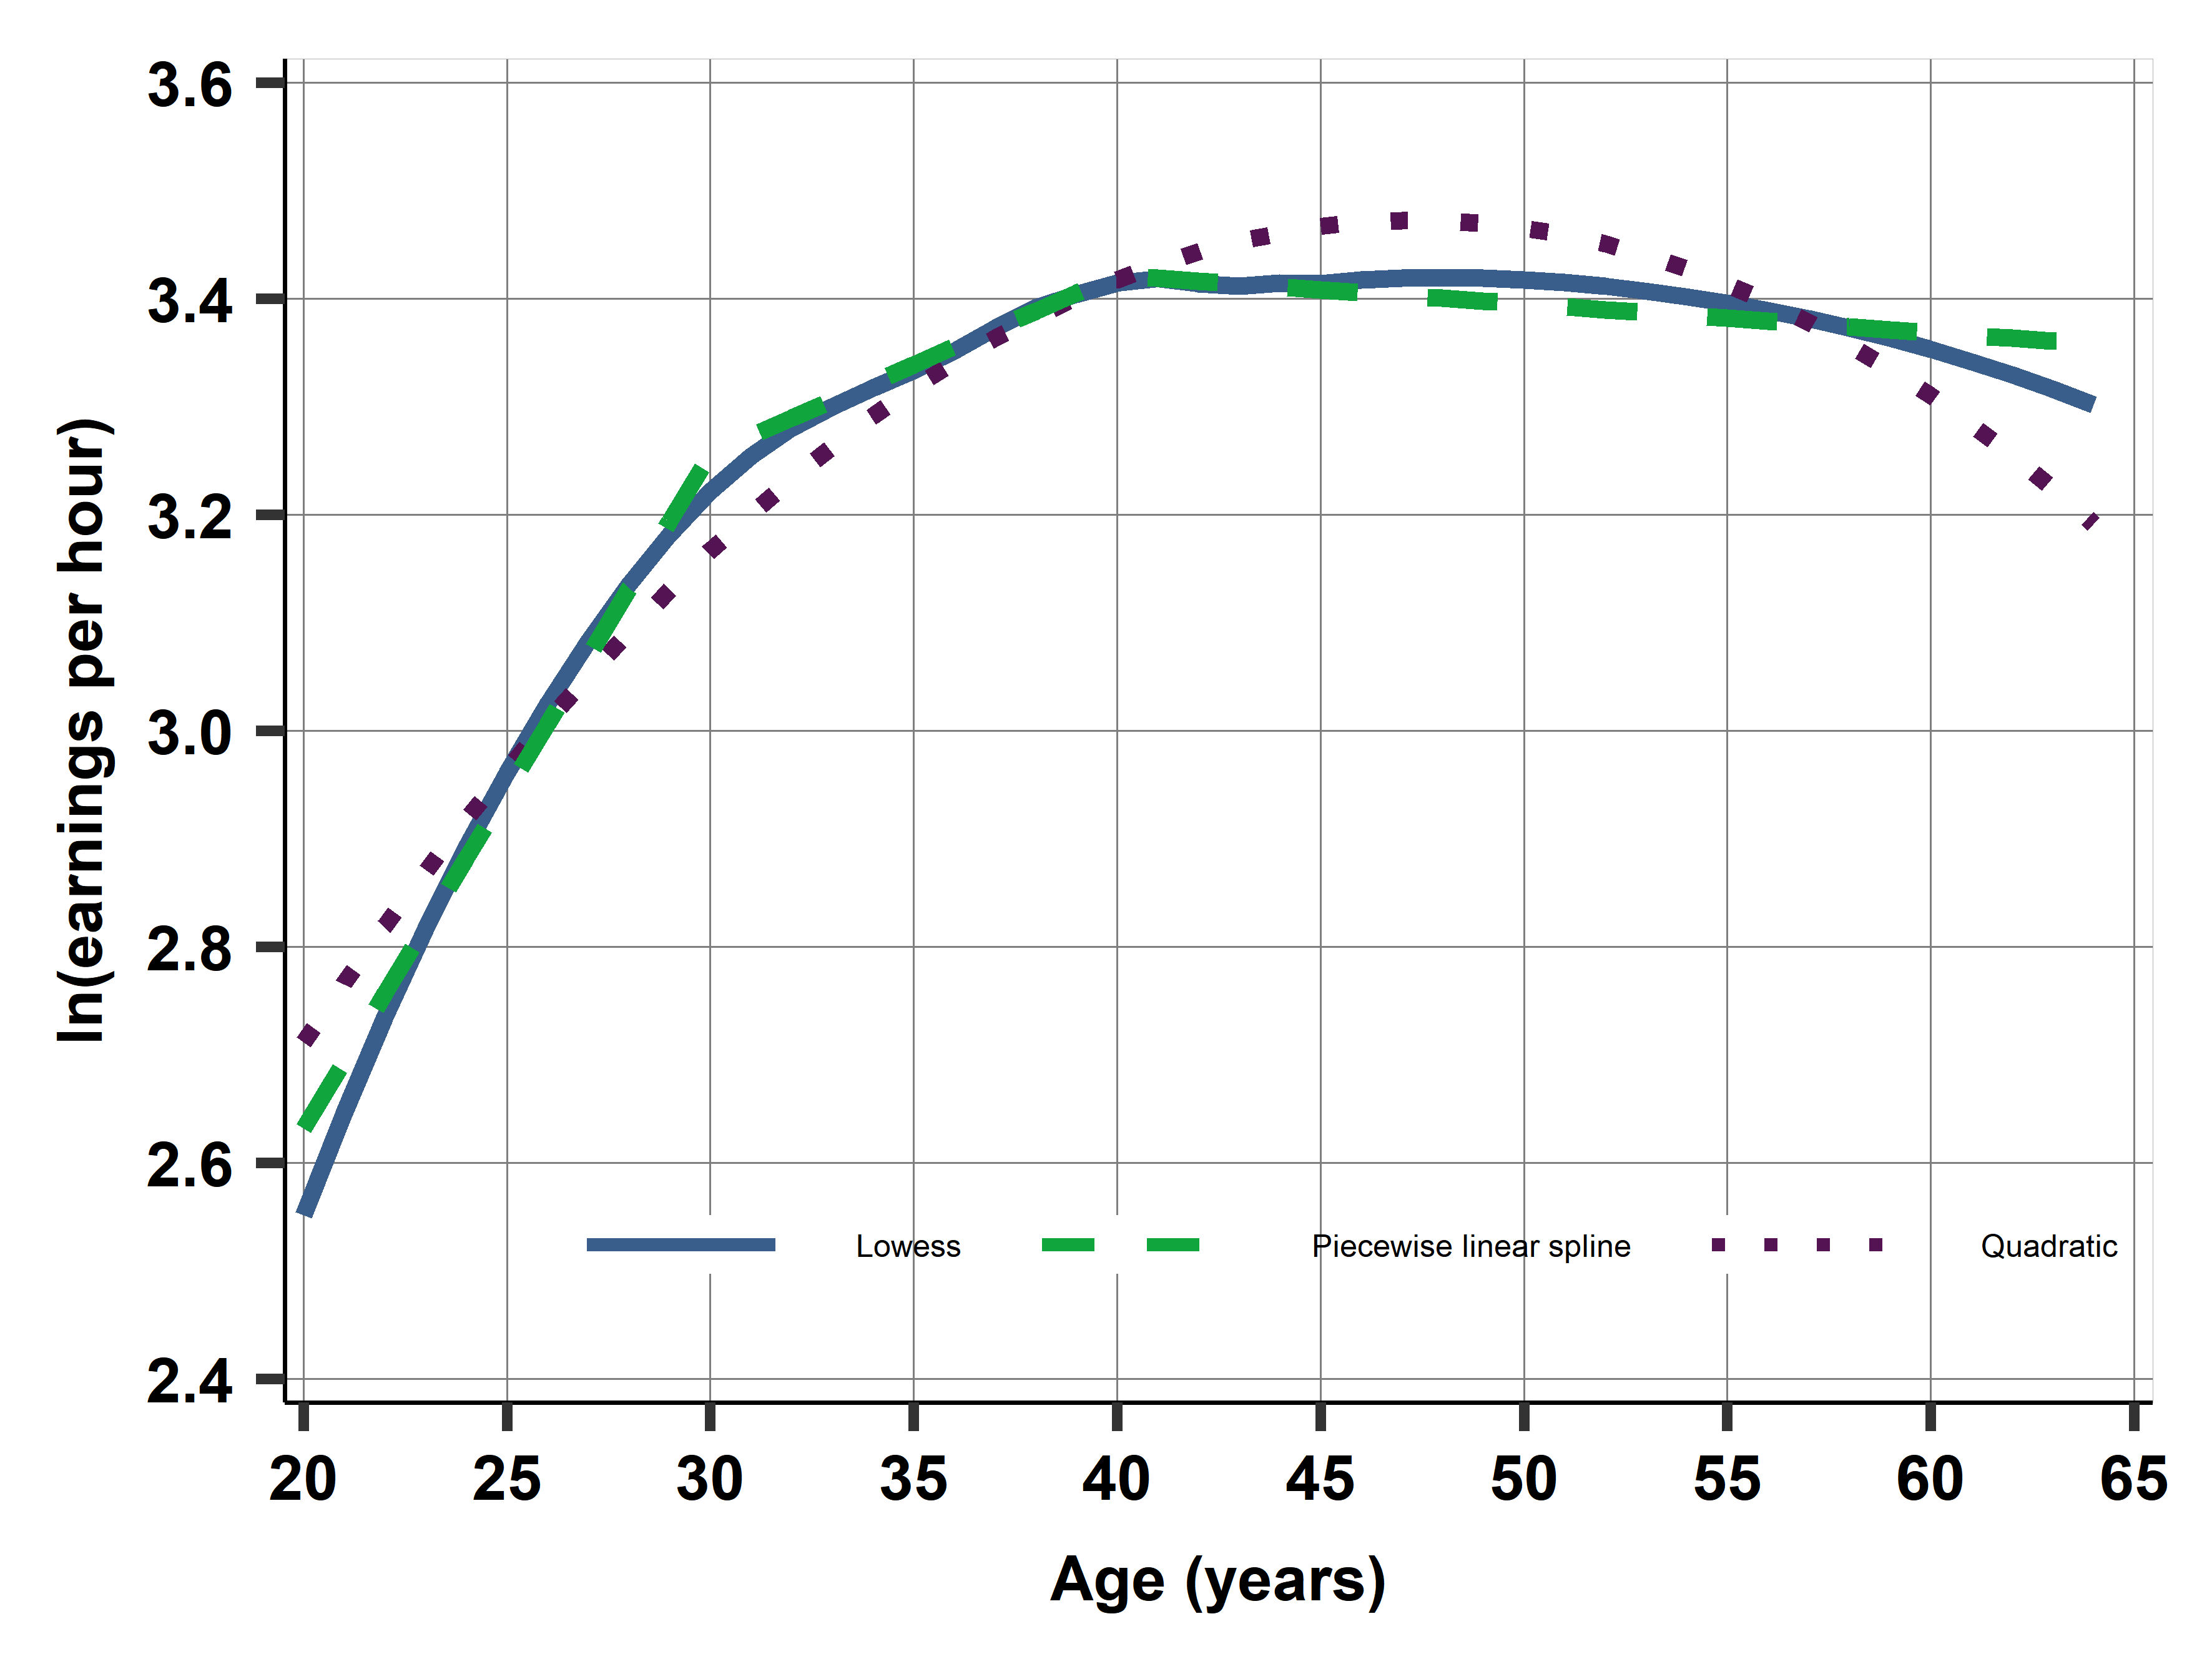
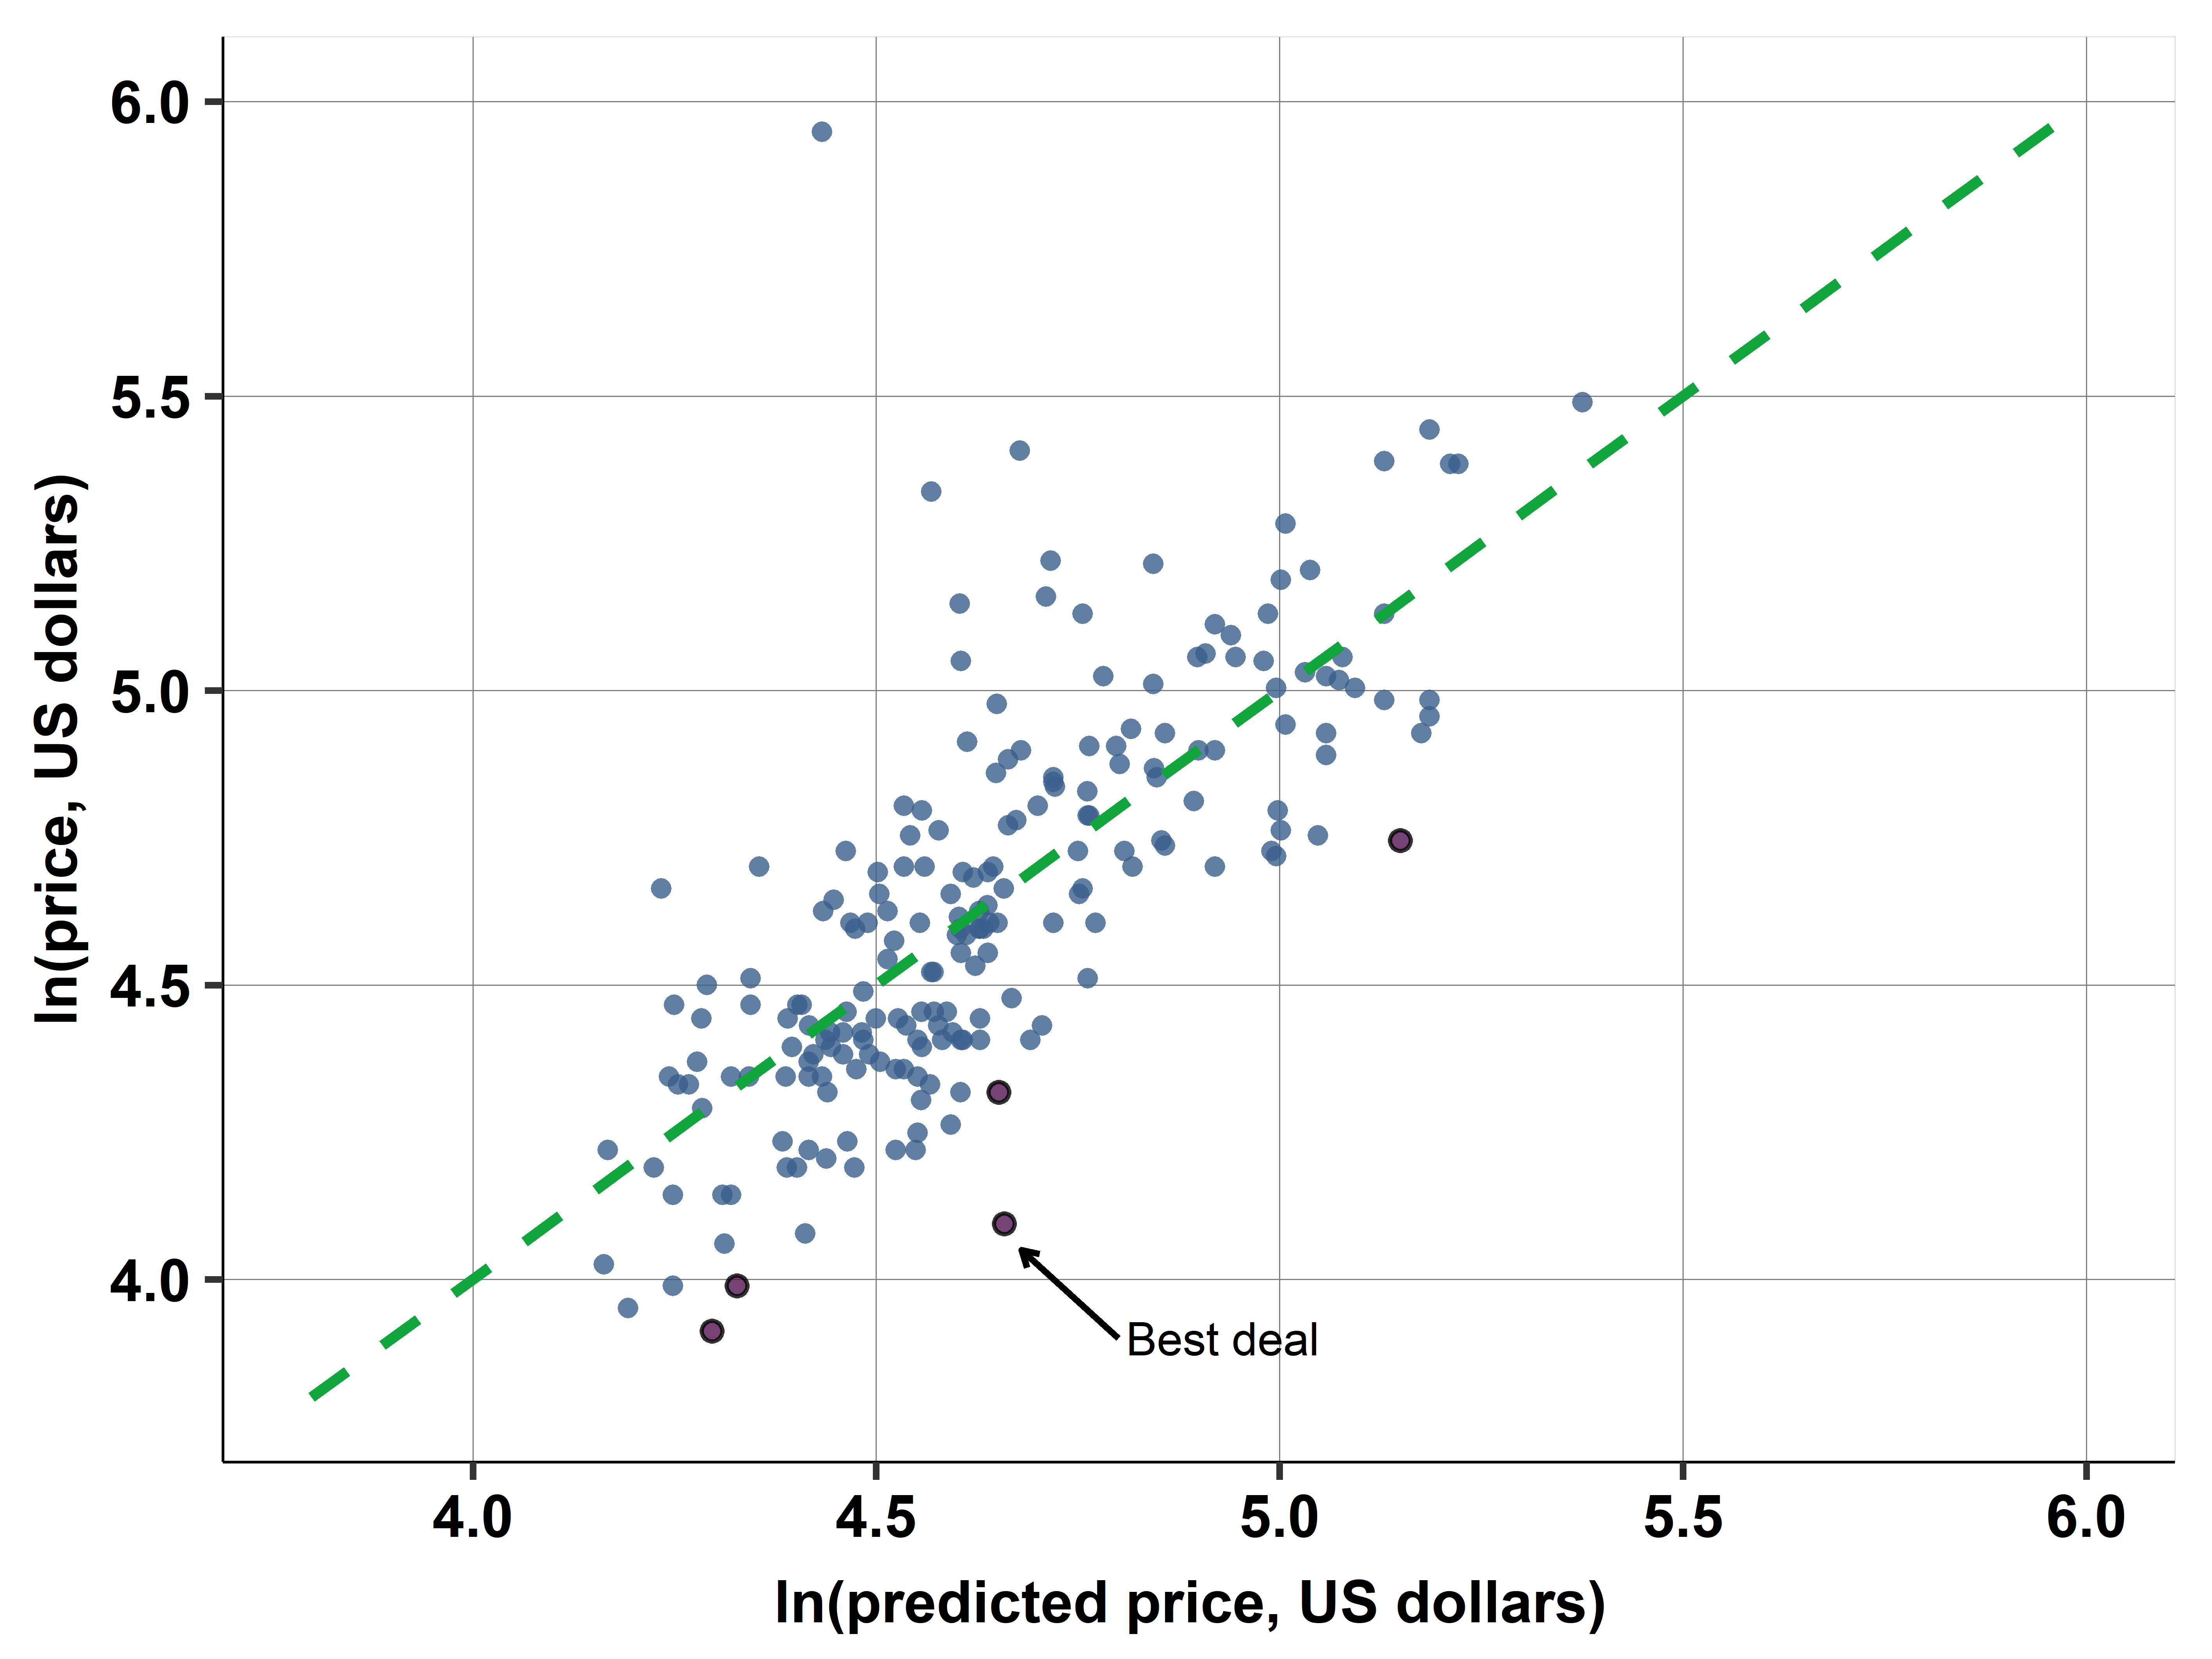
Chapter 08: Complicated Patterns and Messy Data
Chapter summary: This chapter is about complicated patterns and messy data.
The first part of this chapter covers how linear regression analysis can accommodate nonlinear patterns. We discuss transforming either or both the dependent variable and the explanatory variable, such as taking log; piecewise linear spline; and quadratic and higher-order polynomials. We discuss whether and when to apply each technique, we emphasize the correct interpretation of the coefficients of these regressions and how we may visualize their results. The second half of the chapter discusses potential issues with regression analysis with influential observations and measurement error in variables. The chapter closes by discussing whether and how to use weights in regression analysis.
Case Studies:
Ch08A: Finding a good deal among hotels with non-linear function
Ch08B: How is life expectancy related to the average income of a country
Ch08C: Measurement error in hotel ratings
Slides:
Chapter 08 Slideshow
Chapter 09: Generalizing Results of a Regression
Chapter summary: This chapter is about generalizing results of a regression.
This chapter discusses the methods of generalizing results of a linear regression from our data to the general pattern we care about. We start by describing the two steps of generalization in the context of regression analysis: statistical inference and external validity. Then we turn to statistical inference: quantifying uncertainty brought about by generalizing to the general pattern represented by our data. We discuss how to estimate the standard errors and confidence intervals of the estimates of the regression coefficients, how to estimate prediction intervals, and how to test hypotheses about regression coefficients. We introduce ways to visualize the confidence interval and the prediction interval together with the regression line, and we introduce the standard way to present the results of regression analysis in tables.
Case Studies:
Ch09A: Estimating gender and age differences in earnings
Ch09B: How stable is the hotel price-distance to center relationship
Slides:
Chapter 09 Slideshow
Chapter 10: Multiple Linear Regression
Chapter summary: This chapter is about multiple linear regression.
This chapter introduces multiple regression. We start by discussing why and when we should estimate a multiple regression and how to interpret its coefficients. We then turn to how to construct and interpret confidence intervals of regression coefficients and test hypotheses about regression coefficients. We discuss the relationship between multiple regression and simple regression and derive the omitted variable bias. We explain that piecewise linear splines and polynomial regressions are technically multiple linear regressions without the same interpretation of the coefficients. We discuss how to include categorical explanatory variables as well as interactions that help uncover different slopes for groups. We include an informal discussion on how to decide what explanatory variables to include and in what functional form. Finally, we discuss why a typical multiple regression with cross-sectional observational data is not a ceteris paribus comparison, and that, as a result, it may get us closer to causal interpretation without fully uncovering it.
Case Studies:
Ch10A: Understanding the gender difference in earnings
Ch10B: Finding a good deal among hotels with multiple regression
Slides:
Chapter 10 Slideshow
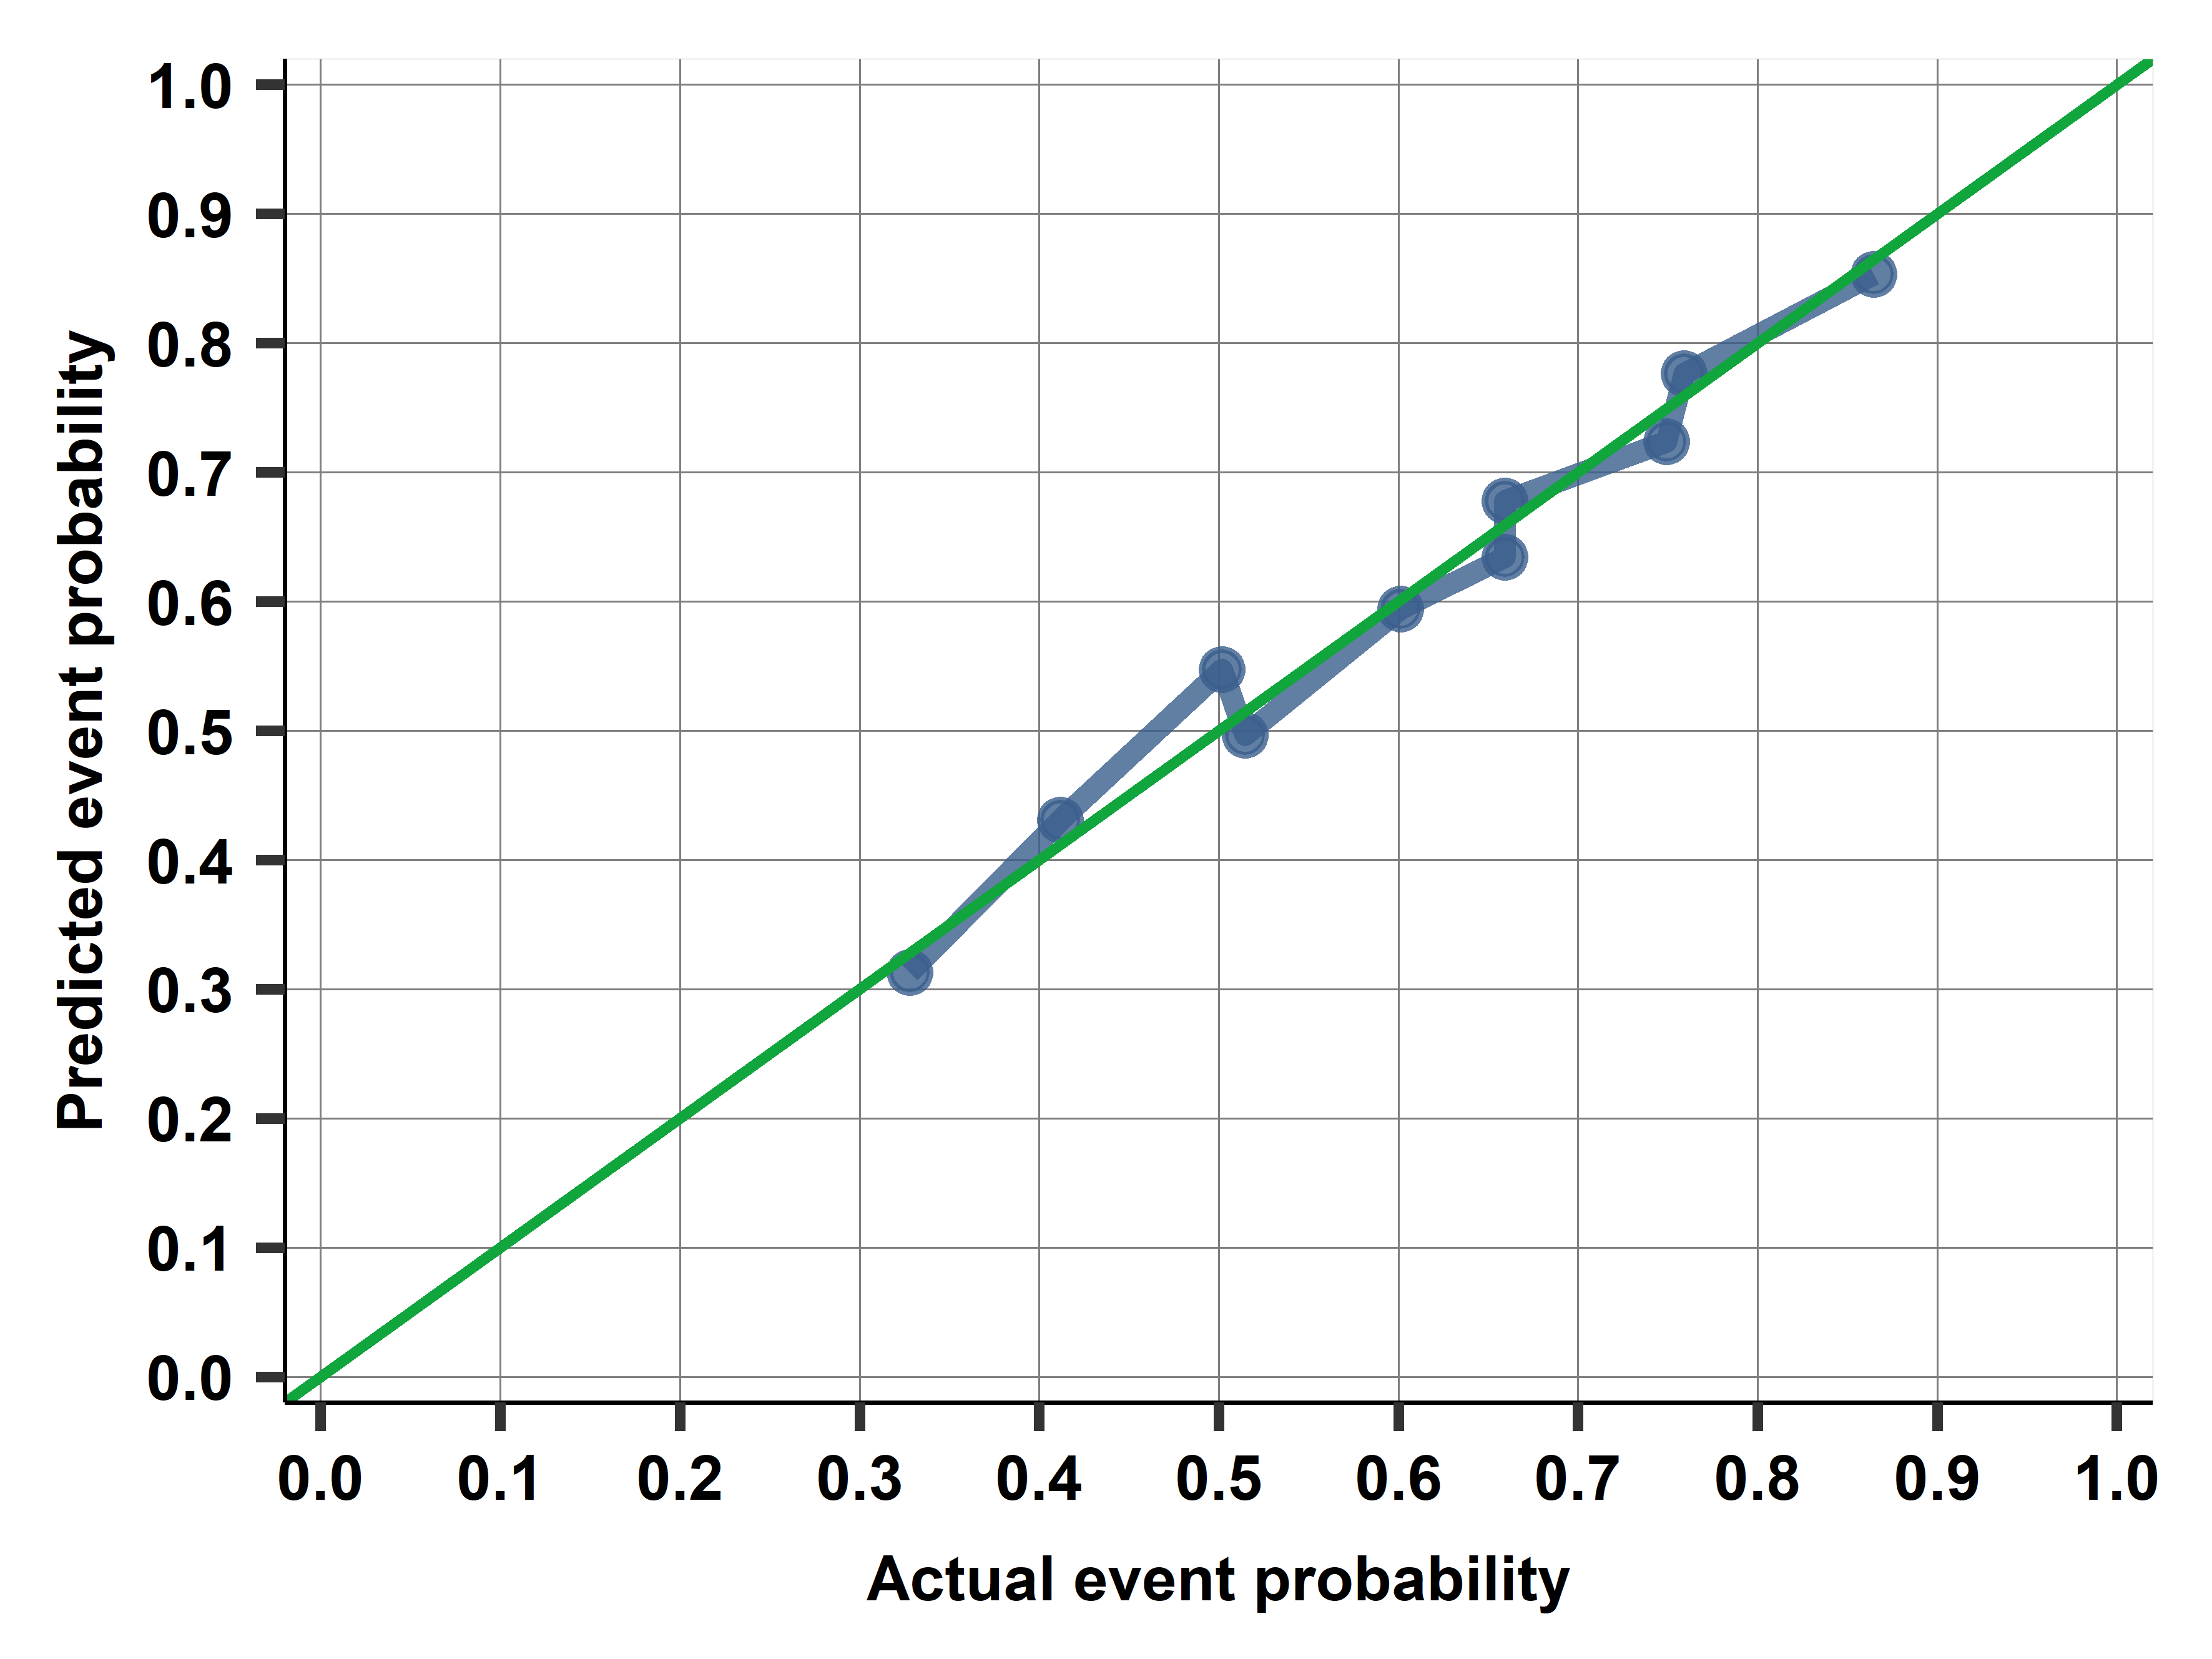
Chapter 11: Modeling Probabilities
Chapter summary: This chapter is about modeling probabilities.
This chapter introduces probability models that have a binary dependent variable. It starts with the linear probability model, and we discuss the interpretation of its coefficients. Linear probability models are usually fine to uncover average associations, but they may be less good for prediction. The chapter introduces the two commonly used alternative models, the logit and the probit. Their coefficients are hard to interpret; we introduce marginal differences that are transformations of the coefficients and have interpretations similar to the coefficients of linear regressions. We argue that linear probability, logit, and probit models often produce very similar results in terms of the associations with explanatory variables, but they may lead to different predictions. We discuss and compare various measures of fit for probability models, such as the Brier-score, and we introduce the concept of calibration. We end by explaining how data analysts can analyze more complicated *y* variables, such as ordinal qualitative variables or duration variables, by turning them into binary ones and estimating probability models.
Case Studies:
Ch11A: Does smoking pose a health risk?
Ch11B: Are Australian weather forecasts well calibrated?
Slides:
Chapter 11 Slideshow
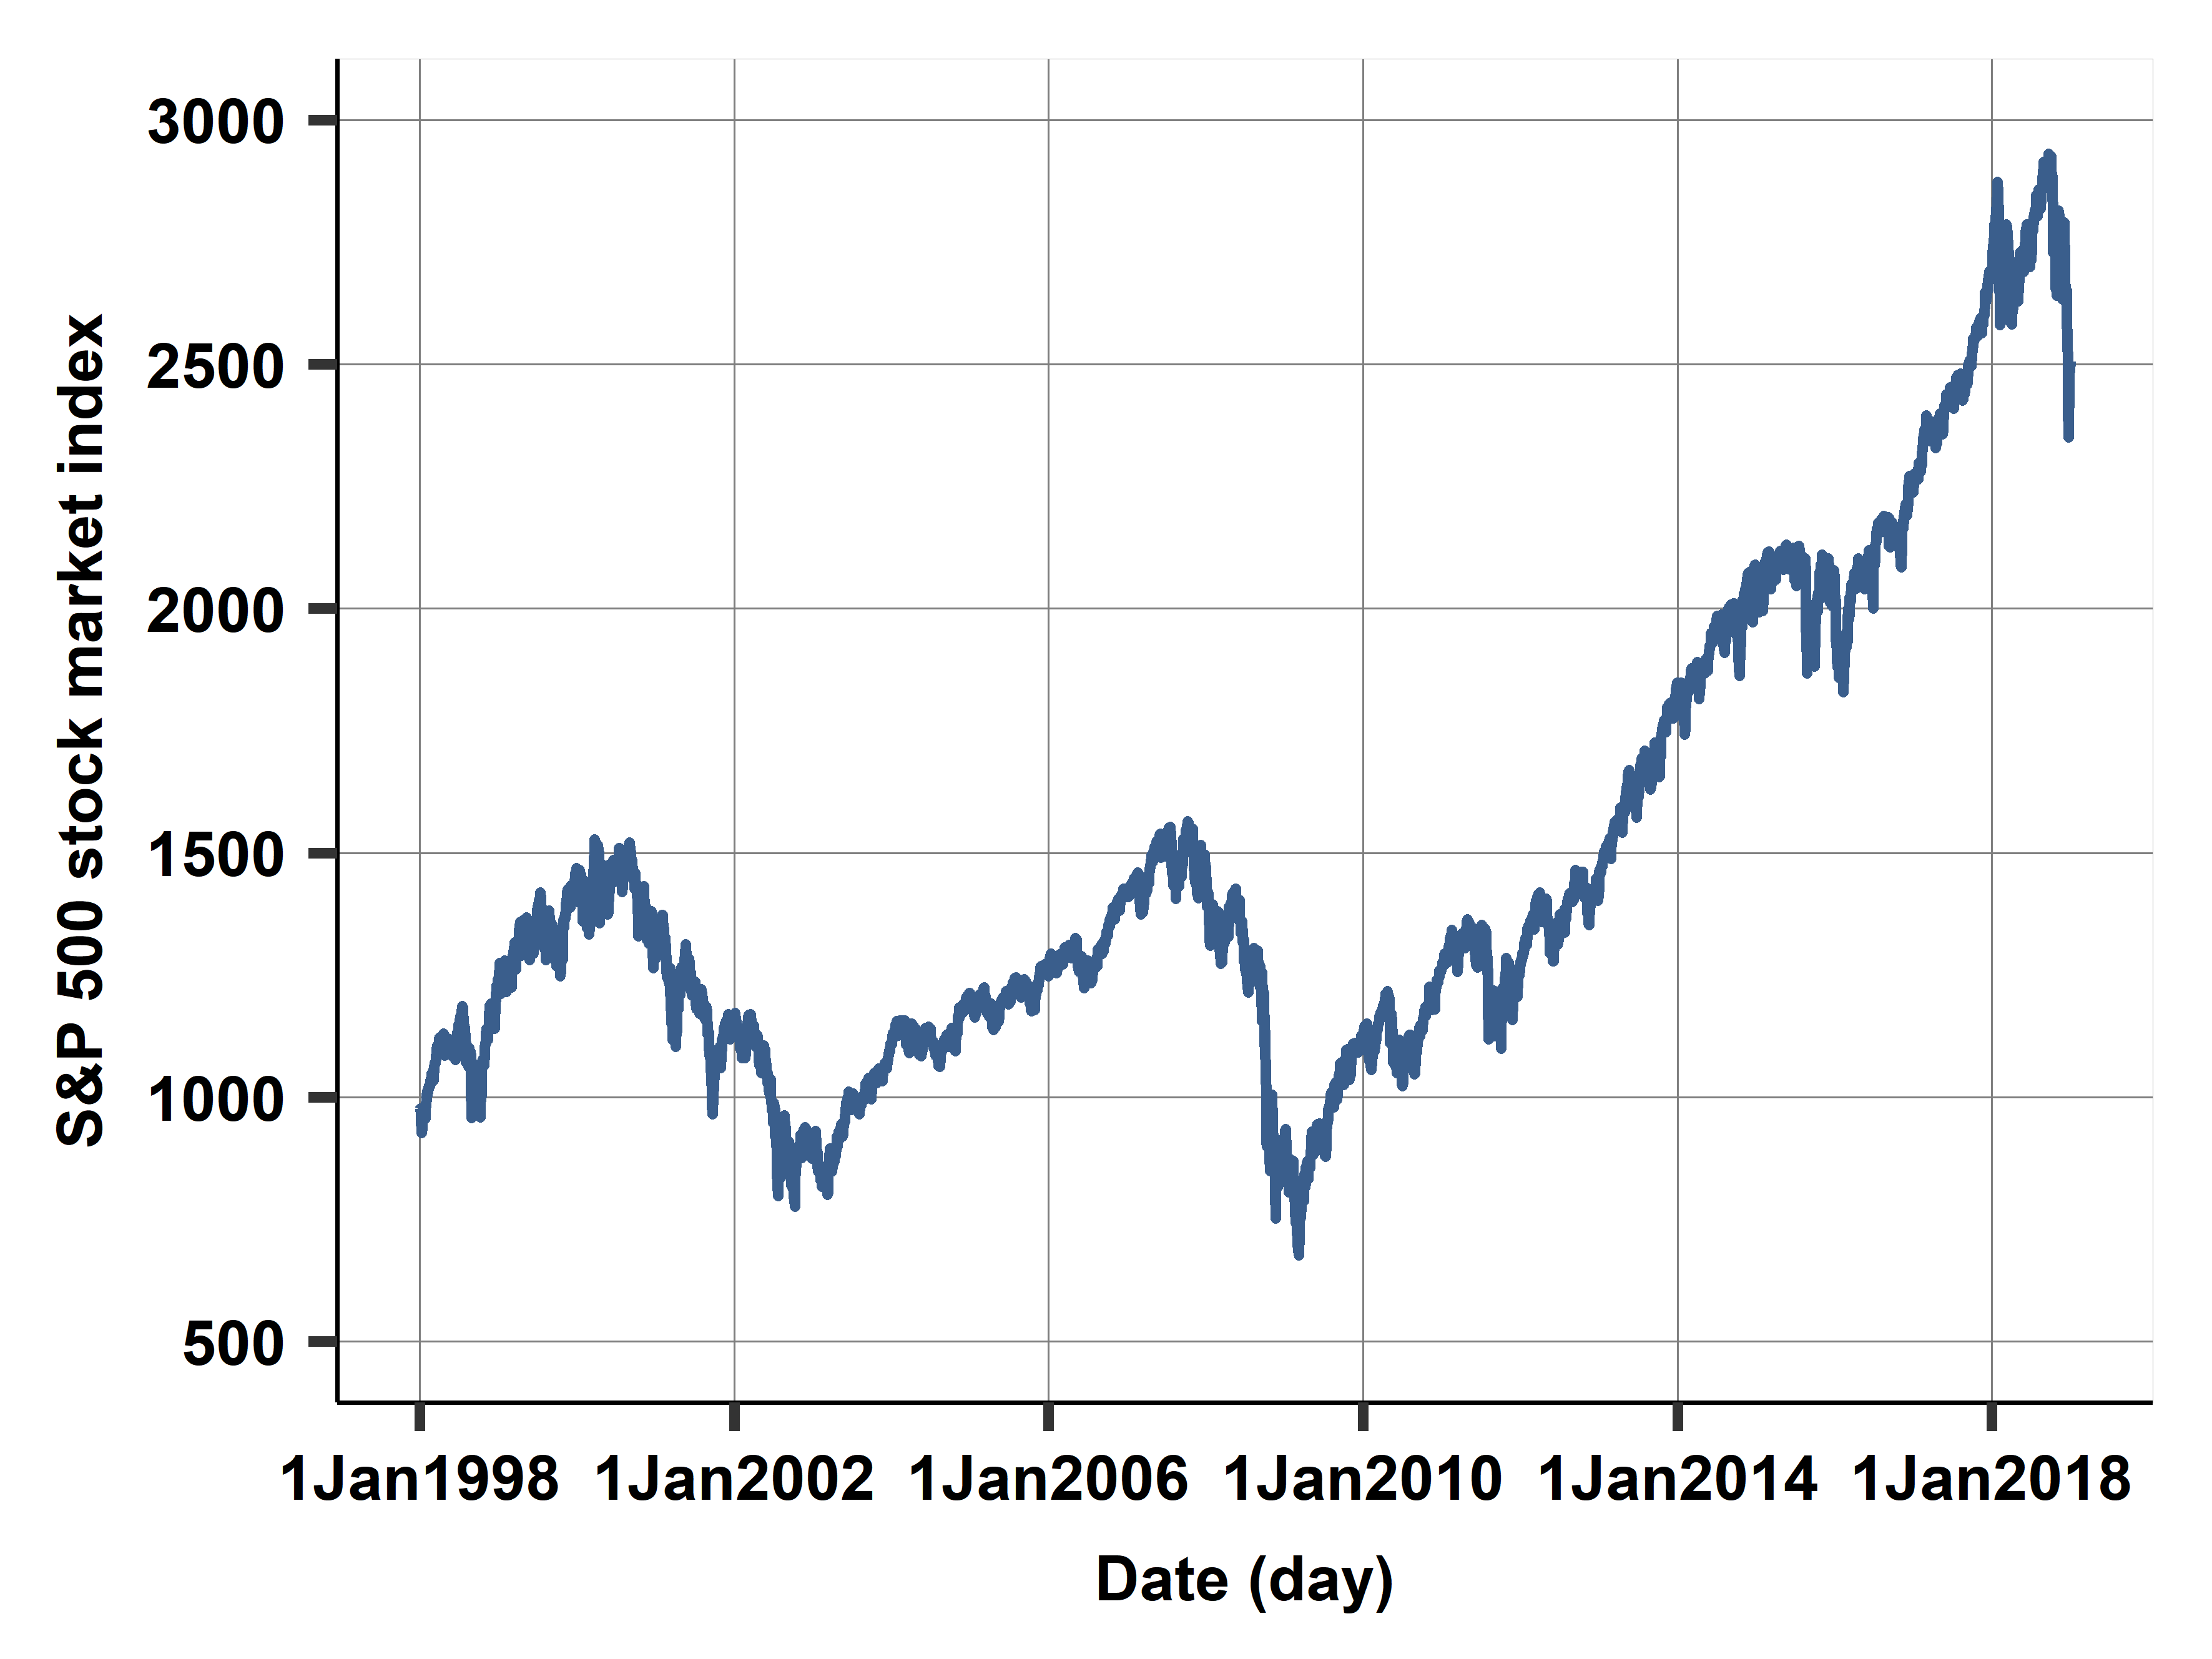
Chapter 12: Regression with Time Series Data
Chapter summary: This chapter is about regression with time series data.
In this chapter we discuss the opportunities and challenges brought about by regression analysis of time series data and how to address those challenges. The chapter starts by discussing features of time series variables, such as trends, seasonality, random walk, and serial correlation. We explain why those features make regression analysis challenging and what we can do about them. In particular, we discuss when it’s a good idea to transform the *y* and *x* variables into differences, or relative differences. We introduce two methods to get appropriate standard error estimates in time series regressions: the Newey–West standard error estimator and including the lagged *y* variable on the right-hand side. We also discuss how we can estimate delayed associations by adding lags of *x* to a time series regression, and how we can directly estimate cumulative, or long run, associations in such a regression.
Case Studies:
Ch12A: Returns on a company stock and market returns
Ch12B: Electricity consumption and temperature
Slides:
Chapter 12 Slideshow