Data Analysis for Business Analytics
A complete Data Analysis package for Business Analytics
MS in Business Analytics, MS Applied Data Science – a variety of names exist for a relatively new breed of Master’s programs. They typically offer a one-year intensive curriculum to build up skills in coding: (#Rstats or #Python), engineering with #SQL, #cloud , #bigdata, #spark and many more as well as management and data analysis.
Data Analysis for Business, Economics, and policy
Data Analysis is a mix of statistics, econometrics, data science, machine learning with the aim of teaching practical skills that analysts may use in real life working in business. As instructor of Data Analysis and program director at CEU MS in Business Analytics for years, I have experimented quite a bit with the curriculum. The experience gave rise to a textbook co-authored with Gabor Kezdi and published by Cambridge University Press. It is currently used in 80+ programs around the world, including a dozen Analytics Master’s programs.
How can this Data Analysis for Business, Economics, and Policy textbook help instructors and students Business Analytics or related programs? We believe it can help in several different aspects.

Four benefits
We think there are four key benefits of using the textbook in Business Analytics education: an approach that aims at highlighting the analytical process, curated content from exploration to machine learning and causal inference, focus on case studies and an ecosystem helping the learning process.
Data analysis is a process
First, it will help students understand that Data analysis is a process. It starts with formulating a question and collecting appropriate data or assessing whether the available data can help answer the question. Then come the tedious but essential tasks of data cleaning and organizing that affect the results of the analysis as much as any other step in the process. Exploratory data analysis gives context to the eventual results and helps deciding the details of the analytical method to be applied. The main analysis consists of choosing and implementing the method to answer the question, with potential robustness checks. Along the way, correct interpretation and effective presentation of the results are crucial. Carefully crafted data visualizations help summarize our findings and convey the key messages. The final task is to answer the original question, with potential qualifications and directions for future inquiries.
Four parts, four courses on data exploration, regressions, prediction and causal inference
Second, it will help you think about a course structure. In our view, a great way to teach the whole process is to organize it in four courses: data exploration, regression analysis, prediction with machine learning, and causal analysis.
-
Data Exploration: The first course starts with discussing (and possibly doing) data collection and thinking about data quality, followed by organizing and cleaning data, exploratory data analysis and data visualization. This first part must also include the key statistical knowledge needed for everything else: important distributions, statistical inference, correlation and hypothesis testing and some sampling methods. You may offer this as a bootcamp or a pre-session allowing more experienced students to exam out.
-
Regression analysis Thorough introduction to regression analysis comes next, including probability models and time series regressions. It is vital for data analysis students to learn designing regression models and deeply understand their output. As part of the process, they may learn the role of selecting a functional form, dealing with uncertainty as well as different types of dependent variables.
-
Prediction with Machine Learning: The third part covers predictive analytics and introduces cross-validation, LASSO, tree-based machine learning methods such as random forest, probability prediction, classification, and forecasting from time series data. This is where modern data science is presented in a prediction context focusing on the “do what works” approach. In this course, only a few methods are presented, but those are discussed in depth. Students may then take additional machine learning classes to master other models like deep learning.
-
Causal effect of interventions: The fourth part covers causal analysis, starting with the potential outcomes framework as well as DAGs (causal maps). Students discuss the role of randomized experiments as well as practical issues doing them offline and online. Statistical methods include difference-in-differences analysis, various panel data methods and the event study approach.
A case study focus
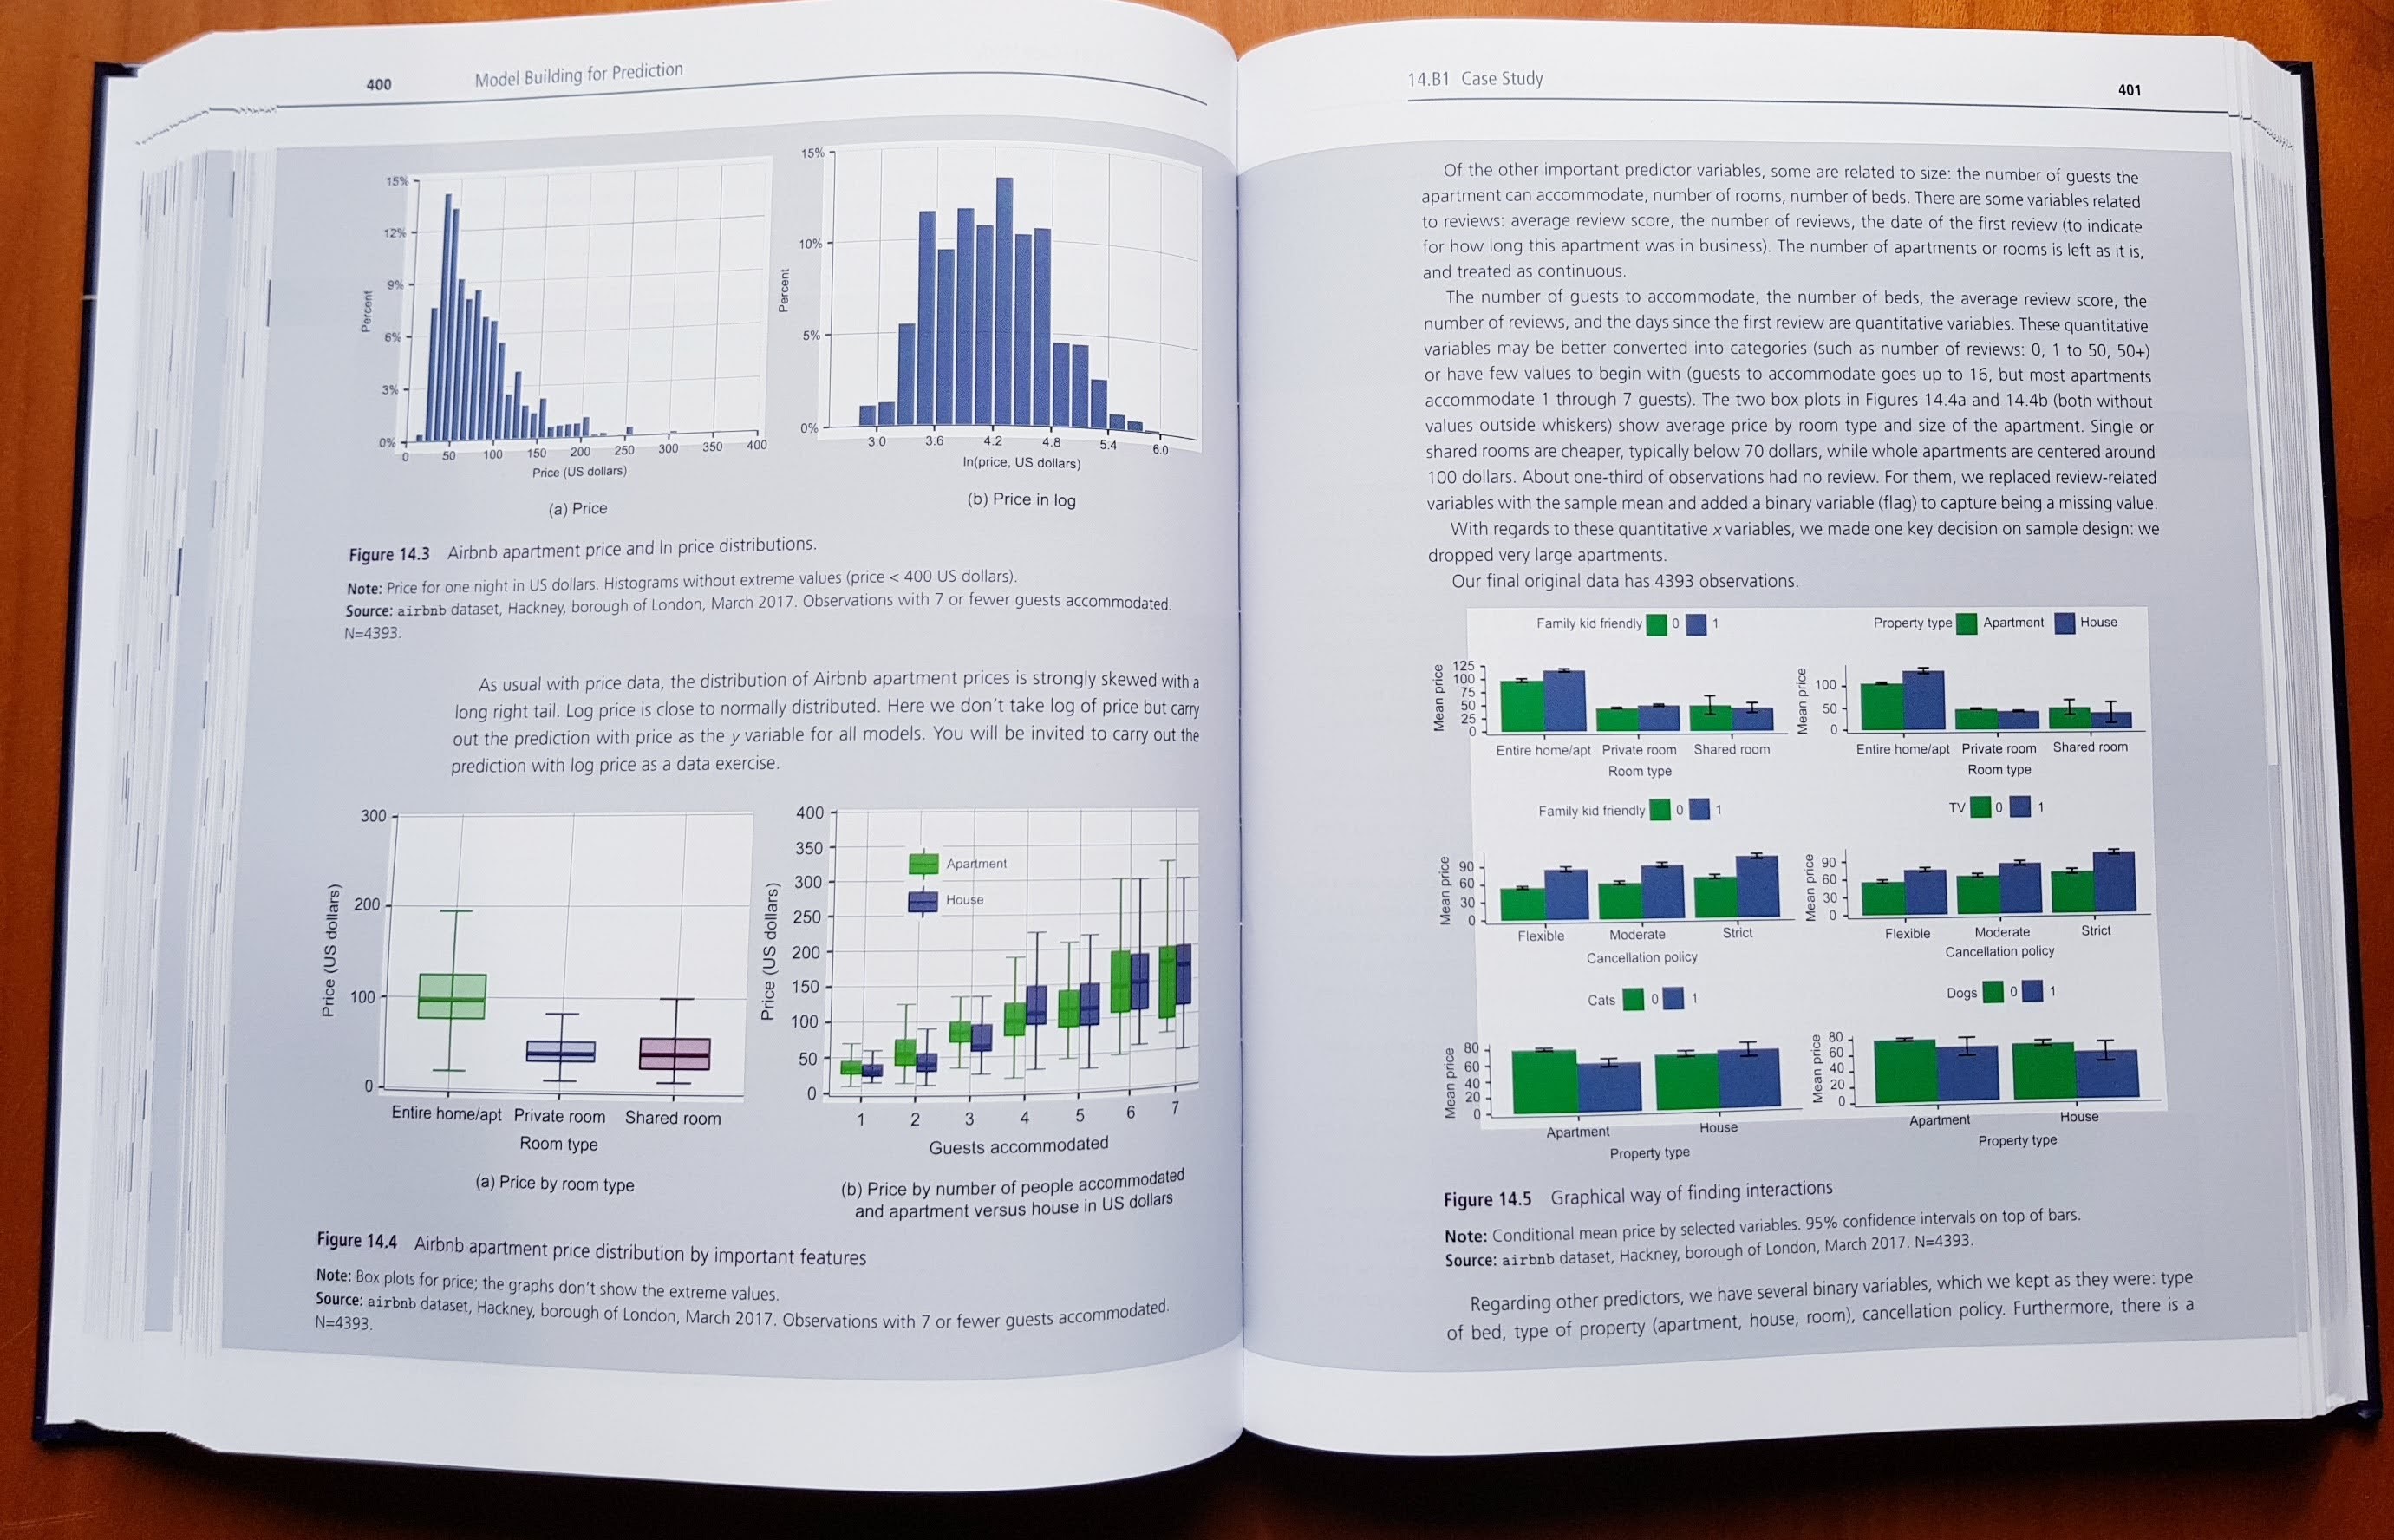
Third, our approach focuses on explaining how to carry out an actual data analysis project from beginning to end. To cover all the steps that are necessary to carry out an actual data analysis project, we lean on a set of fully developed case studies. While each case study focuses on the method discussed in the chapter, they illustrate all elements of the process from question through analysis to conclusion. Our case studies cover a wide range of topics, with a potential appeal to a wide range of students. They include consumer decision, economic and social policy, finance, business and management, health, and sport. Their regional coverage is also wider than usual: one third is from the U.S.A., one third is from Europe and the U.K., and one third is from other countries or includes all parts of the world, from Australia to Thailand.

The ecosystem
Fourth, there is an ecosystem built into and around the textbook, consisting of
- online datasets,
- online code in Stata, R, and Python
- in text practice questions (360)
- in text data exercises (120)
- online reading recommendations
- online suggested practice datasets
- online suggestions to learn coding ideas in R, Stata and Python
- complete coding course for Data Analysis in R (NEW)
- For instructors, lecture slides at Cambridge UP website, also available in latex/overleaf
Why use it?
In summary, analytic process orientation, comprehensive coverage of key topics, a focus on cases studies and a massive ecosystem (with data, code and even a coding course) makes this package a great value for instructors and students in Business analytics or applied data science programs.
The book is endorsed by two Nobel laureates (Angrist and Card), the dean of Yale School of Management (Charles) and many leading scholars. It is already adopted in over 80 courses globally, including Columbia, U Texas, U Michgan, Penn State, Pittsburgh, U of California, Simon Fraser, UCLondon, Cambridge Judge, Essex, ESSEC, Bocconi, Berlin, CEU Vienna, Budapest, Amsterdam, UC Dublin, UWA Perth, Kyoto.
You may buy the book: Amazon.com, or a great deal of global options
Request an examination copy from the Publisher (or DM me)
Contact us
Follow us on Twitter and Facebook
As noted earlier, data analysis is a process. Hopefully we can help you enjoy the journey.
